On this page
Smart Irrigation Monitor user guide
Smart Irrigation Monitor uses your Bluebot meter to monitor your irrigation system. During a short setup it learns the normal water flow of each station. After that, every time a program runs, Bluebot compares what it sees against that baseline and alerts you when a station uses too much water (often a leak or a stuck valve) or too little (often a clog or a broken head).
What you can do with it
- Get a text when a station leaks, clogs, or breaks.
- See how much water each program uses, per run and over time.
- Catch watering that was not supposed to happen.
- Choose who gets alerted, such as a property manager or technician.
Key terms
These terms appear throughout the app and this guide.
| Controller | The box that turns stations on and off. Some systems have more than one. |
| Station | A single watering zone, such as "Front Lawn." Also called a zone. |
| Program | A scheduled run that waters a set of stations in order. Also called a cycle. |
| Run | One time a program actually ran. Each run has its own chart and stats. |
| Flow | How fast water is moving, in gallons per minute (gpm). |
| Baseline | The normal flow rate Bluebot learns for each station during setup. |
| Threshold | How far flow can drift from baseline before it counts as a problem. Default is plus or minus 20%. |
| Anomaly | A run that fell outside its thresholds. |
| Manual watering | Watering that did not match any known program. |
| Bluebot AI | Recognizes new programs as they run and creates them automatically, assigning stations by average flow rate. |
Quick setup (recommended)
The fastest way to set up is to run all your stations once and let Bluebot detect your system. Plan for about two minutes per station.
1. Open Smart Irrigation Monitor
On your device, open the Irrigation tab and tap Get Started. The setup screen offers two paths. Choose Run All Stations.
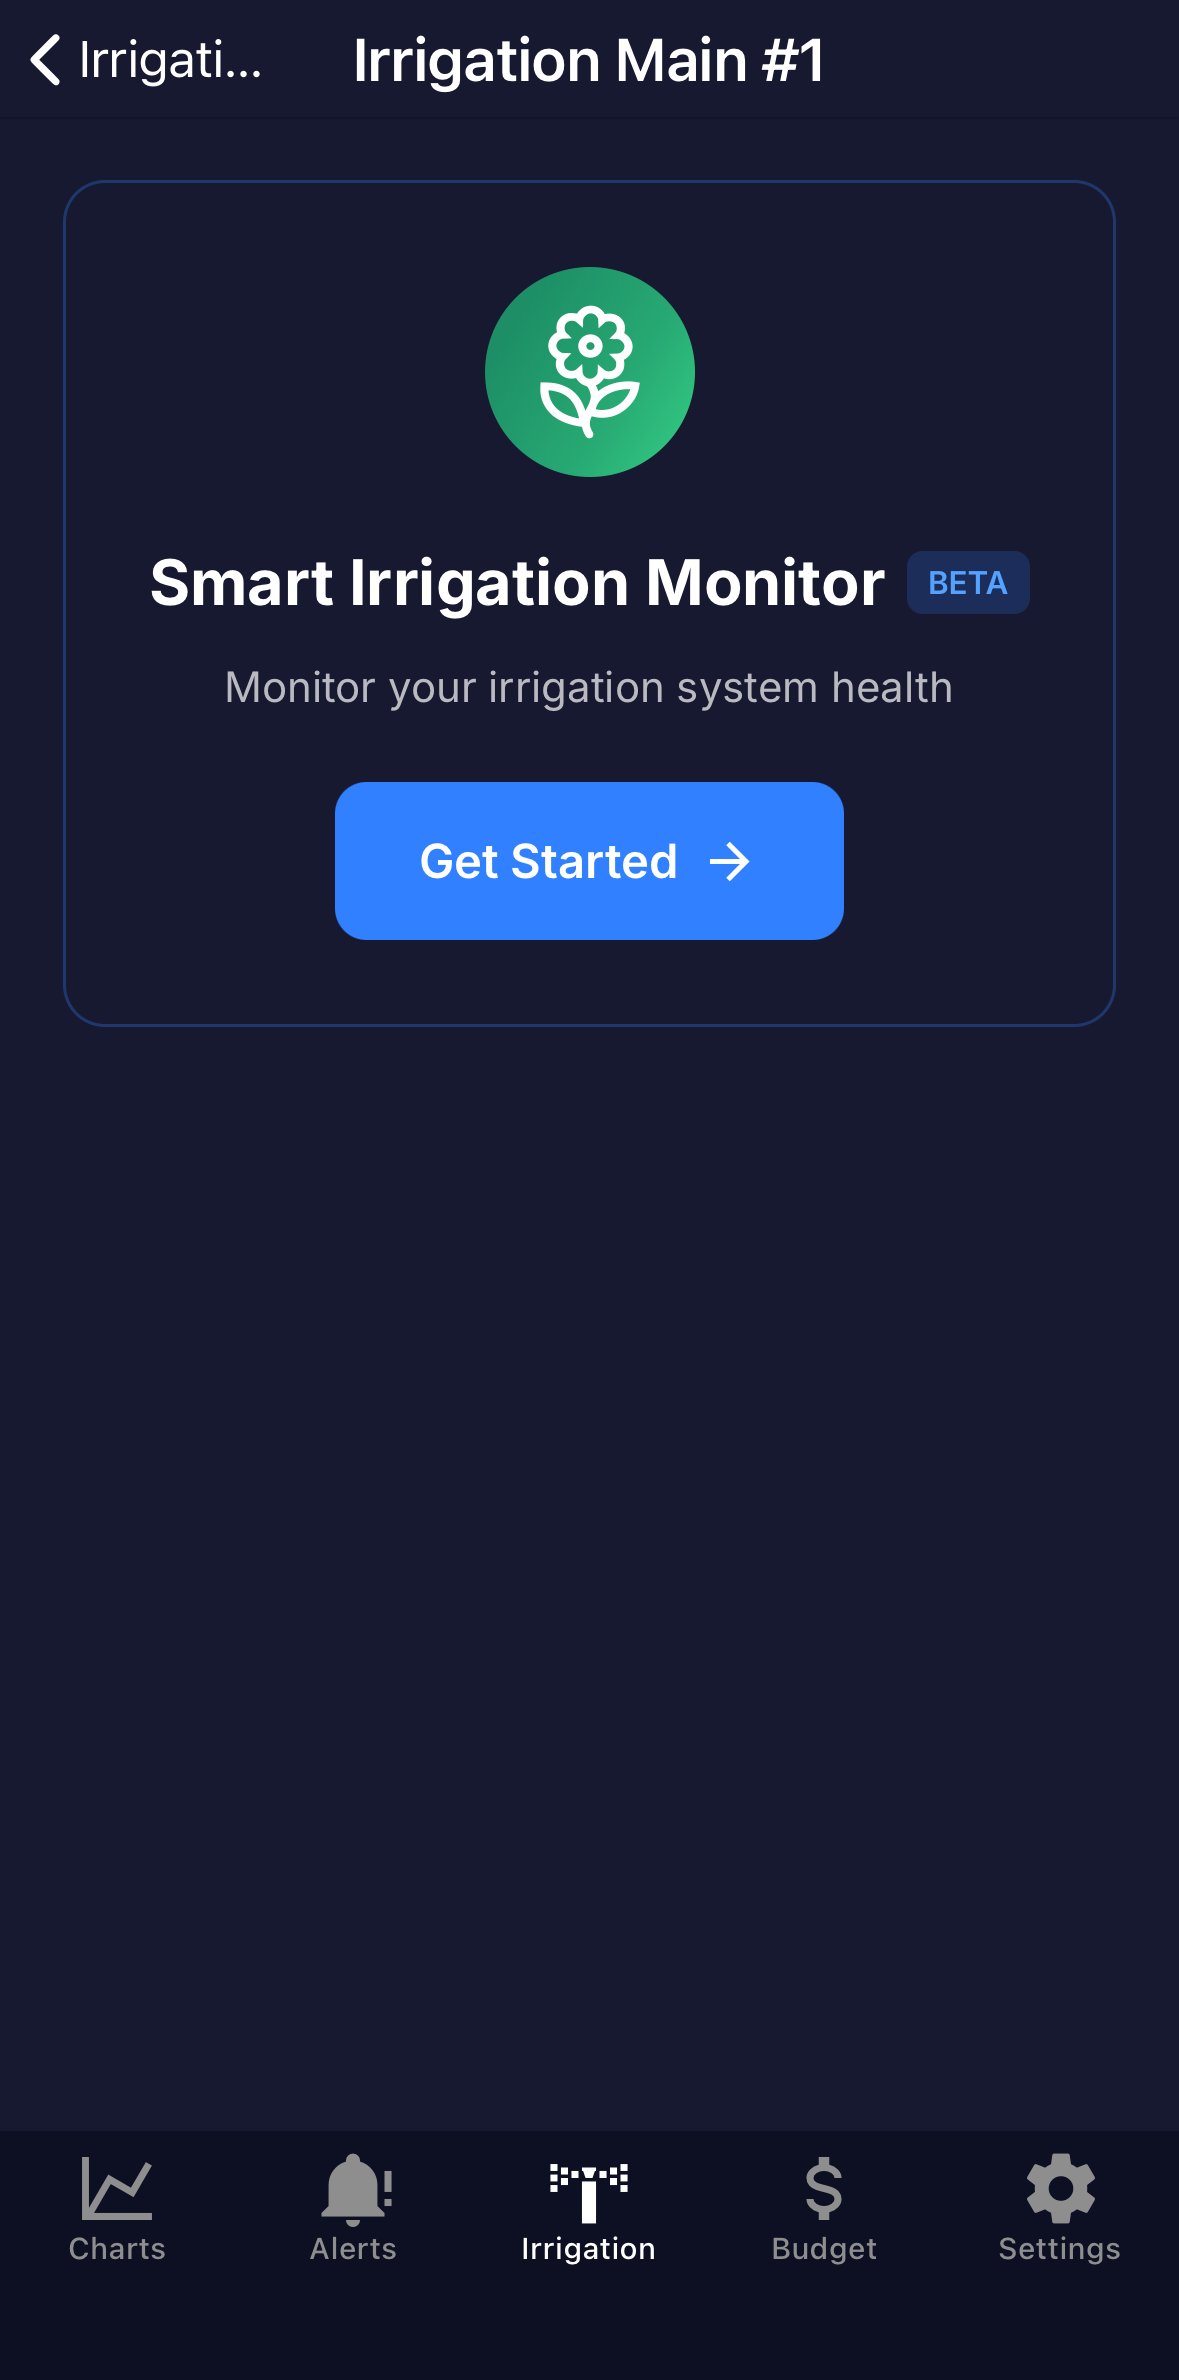 The Irrigation tab, with Get Started.
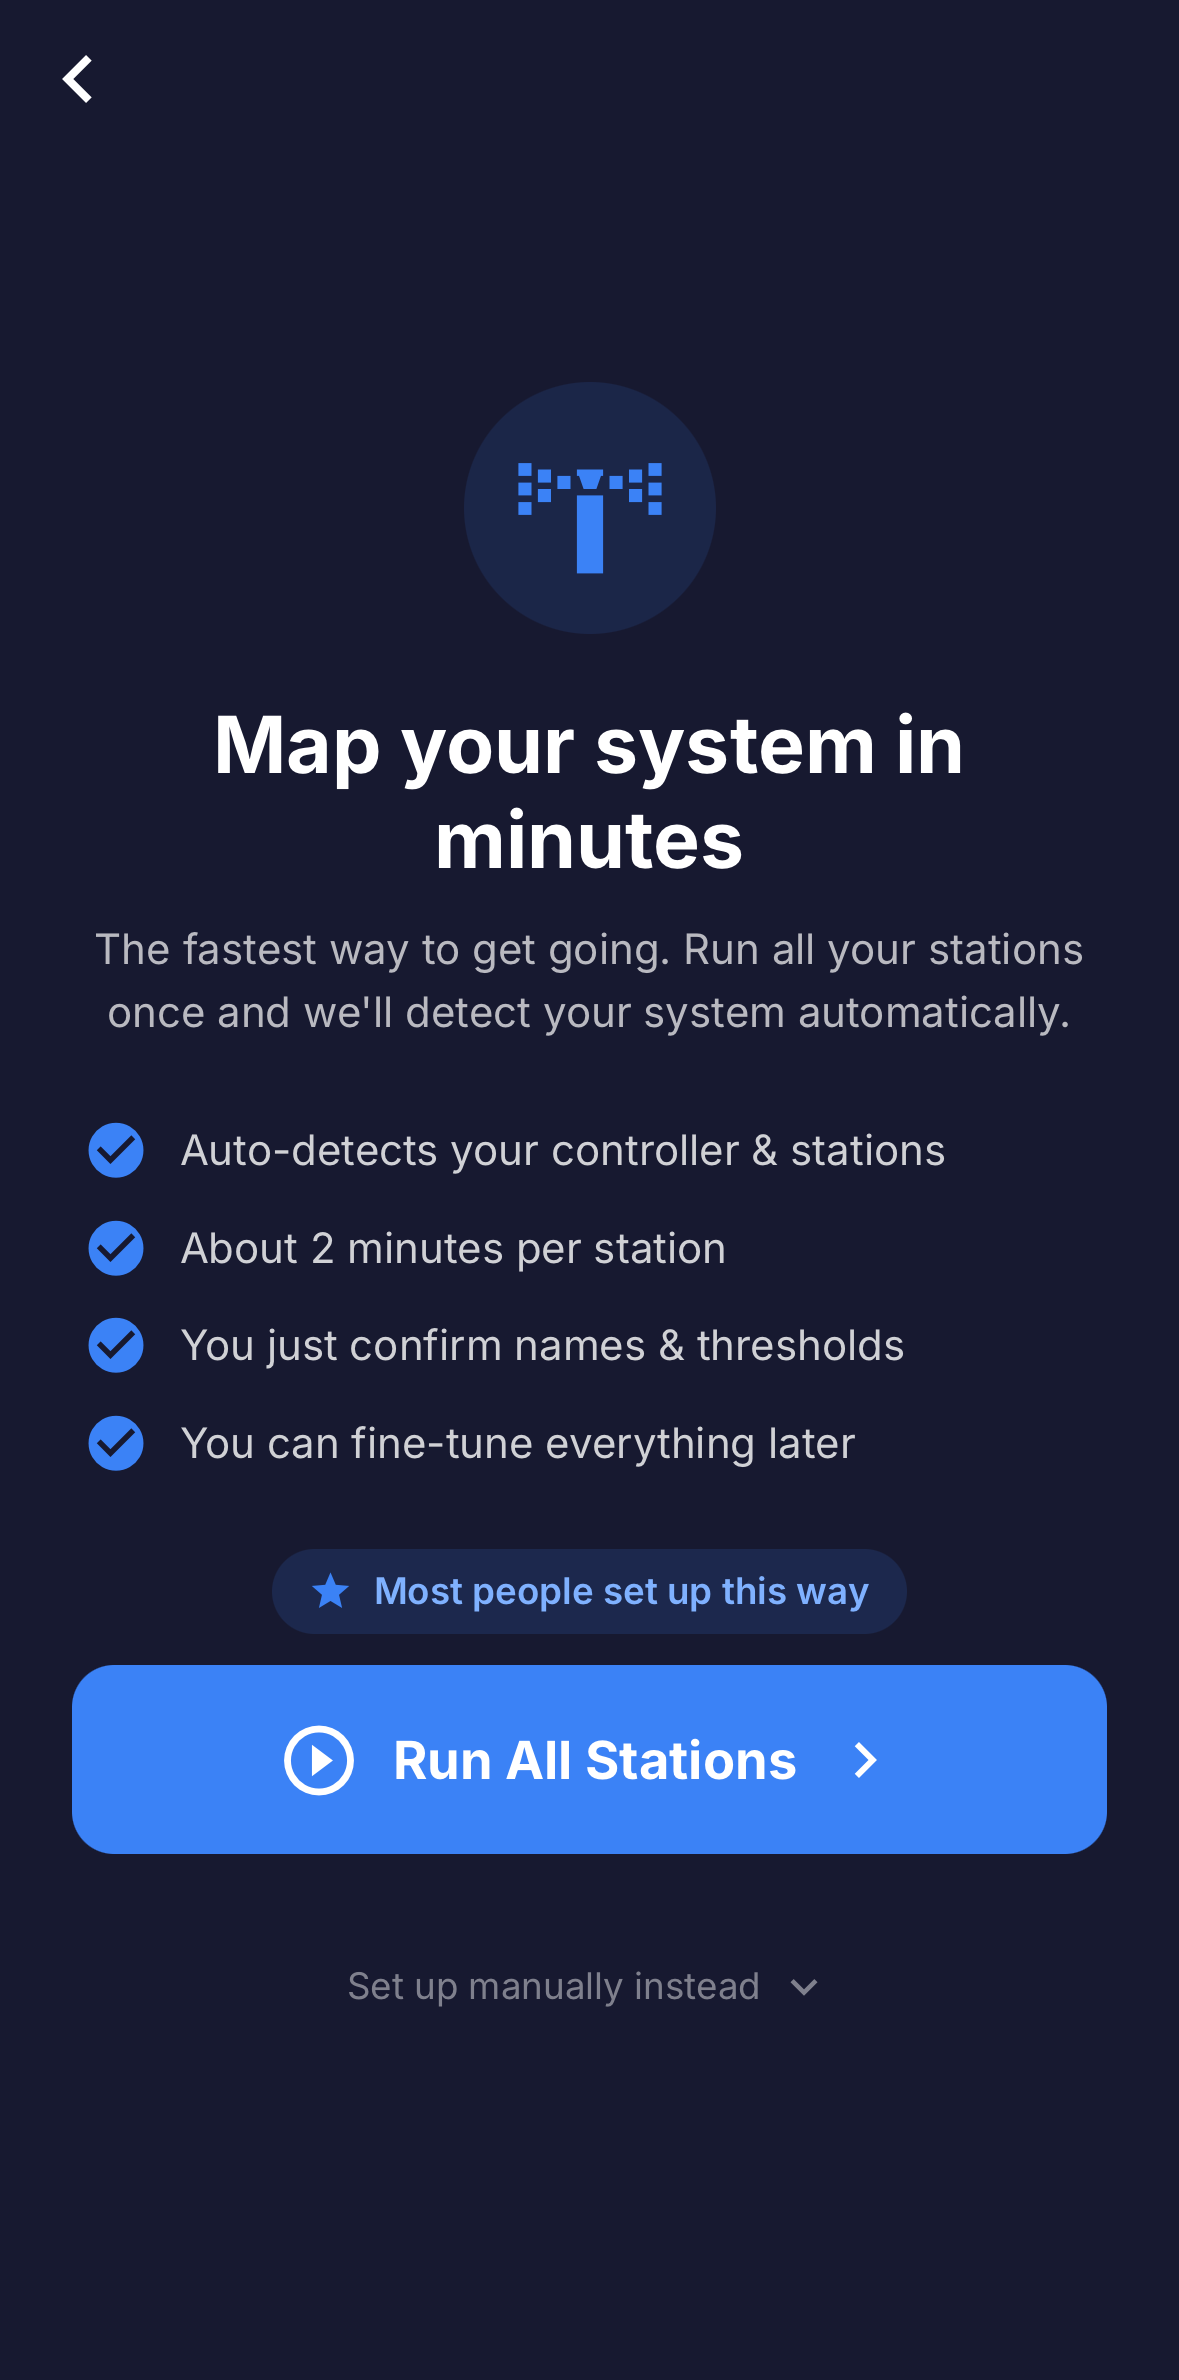 Setup choice screen, "Run All Stations" recommended.
2. Run every station once
Bluebot waits for water to start flowing. Go to your physical controller and start its "Test All Stations" mode so every station runs once, one by one. Controllers vary, so yours may look different. You can leave the app and come back; Bluebot detects the run on its own.
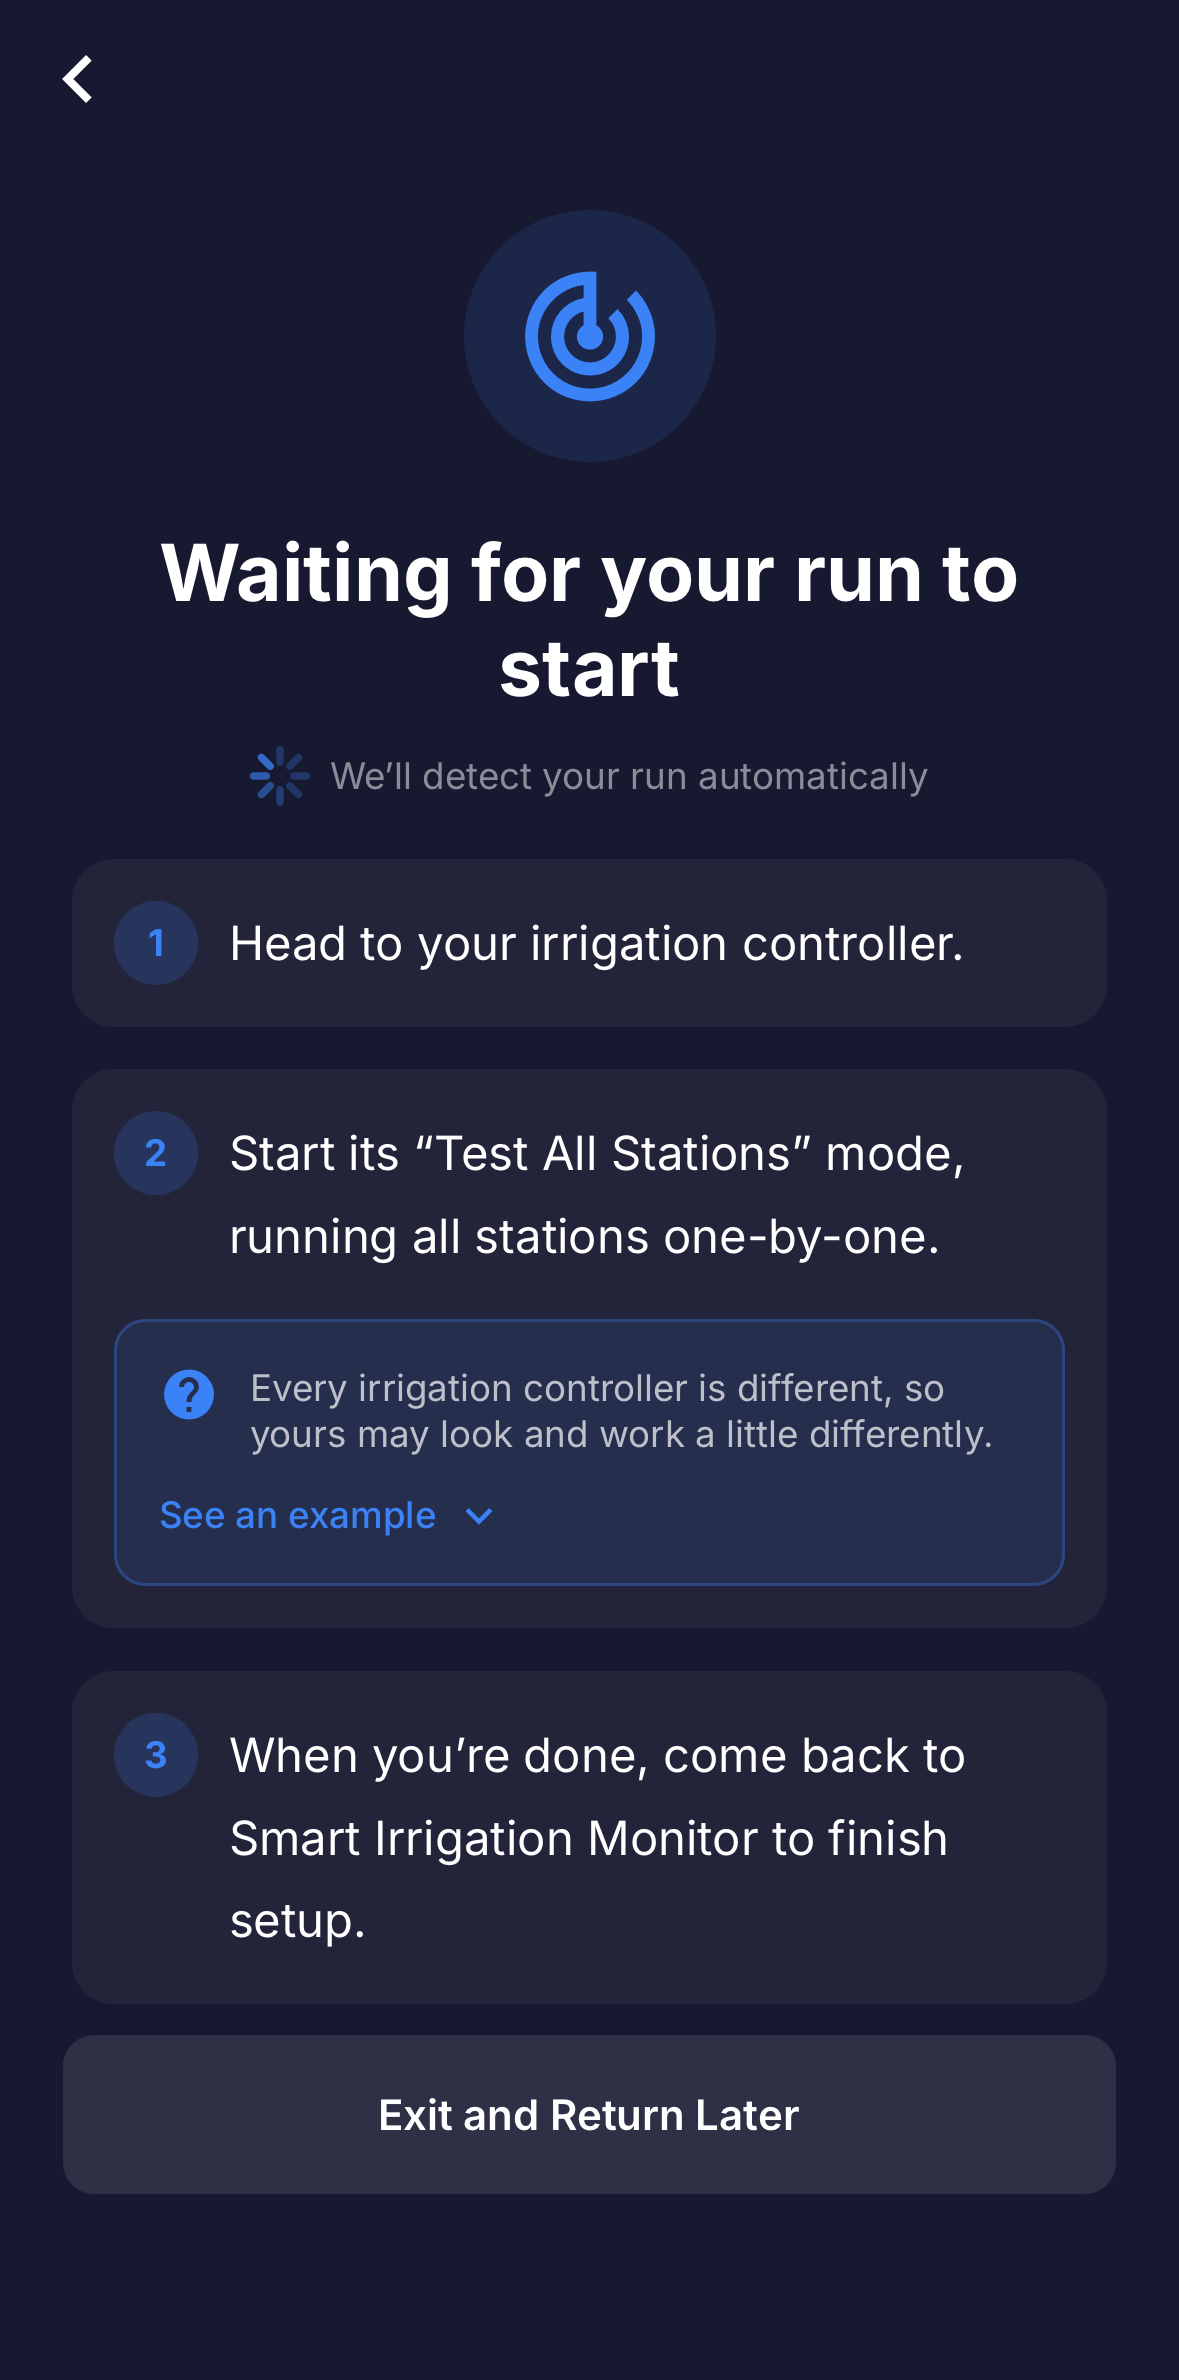 "Waiting for your run to start," with instructions.
3. Watch it detect your stations
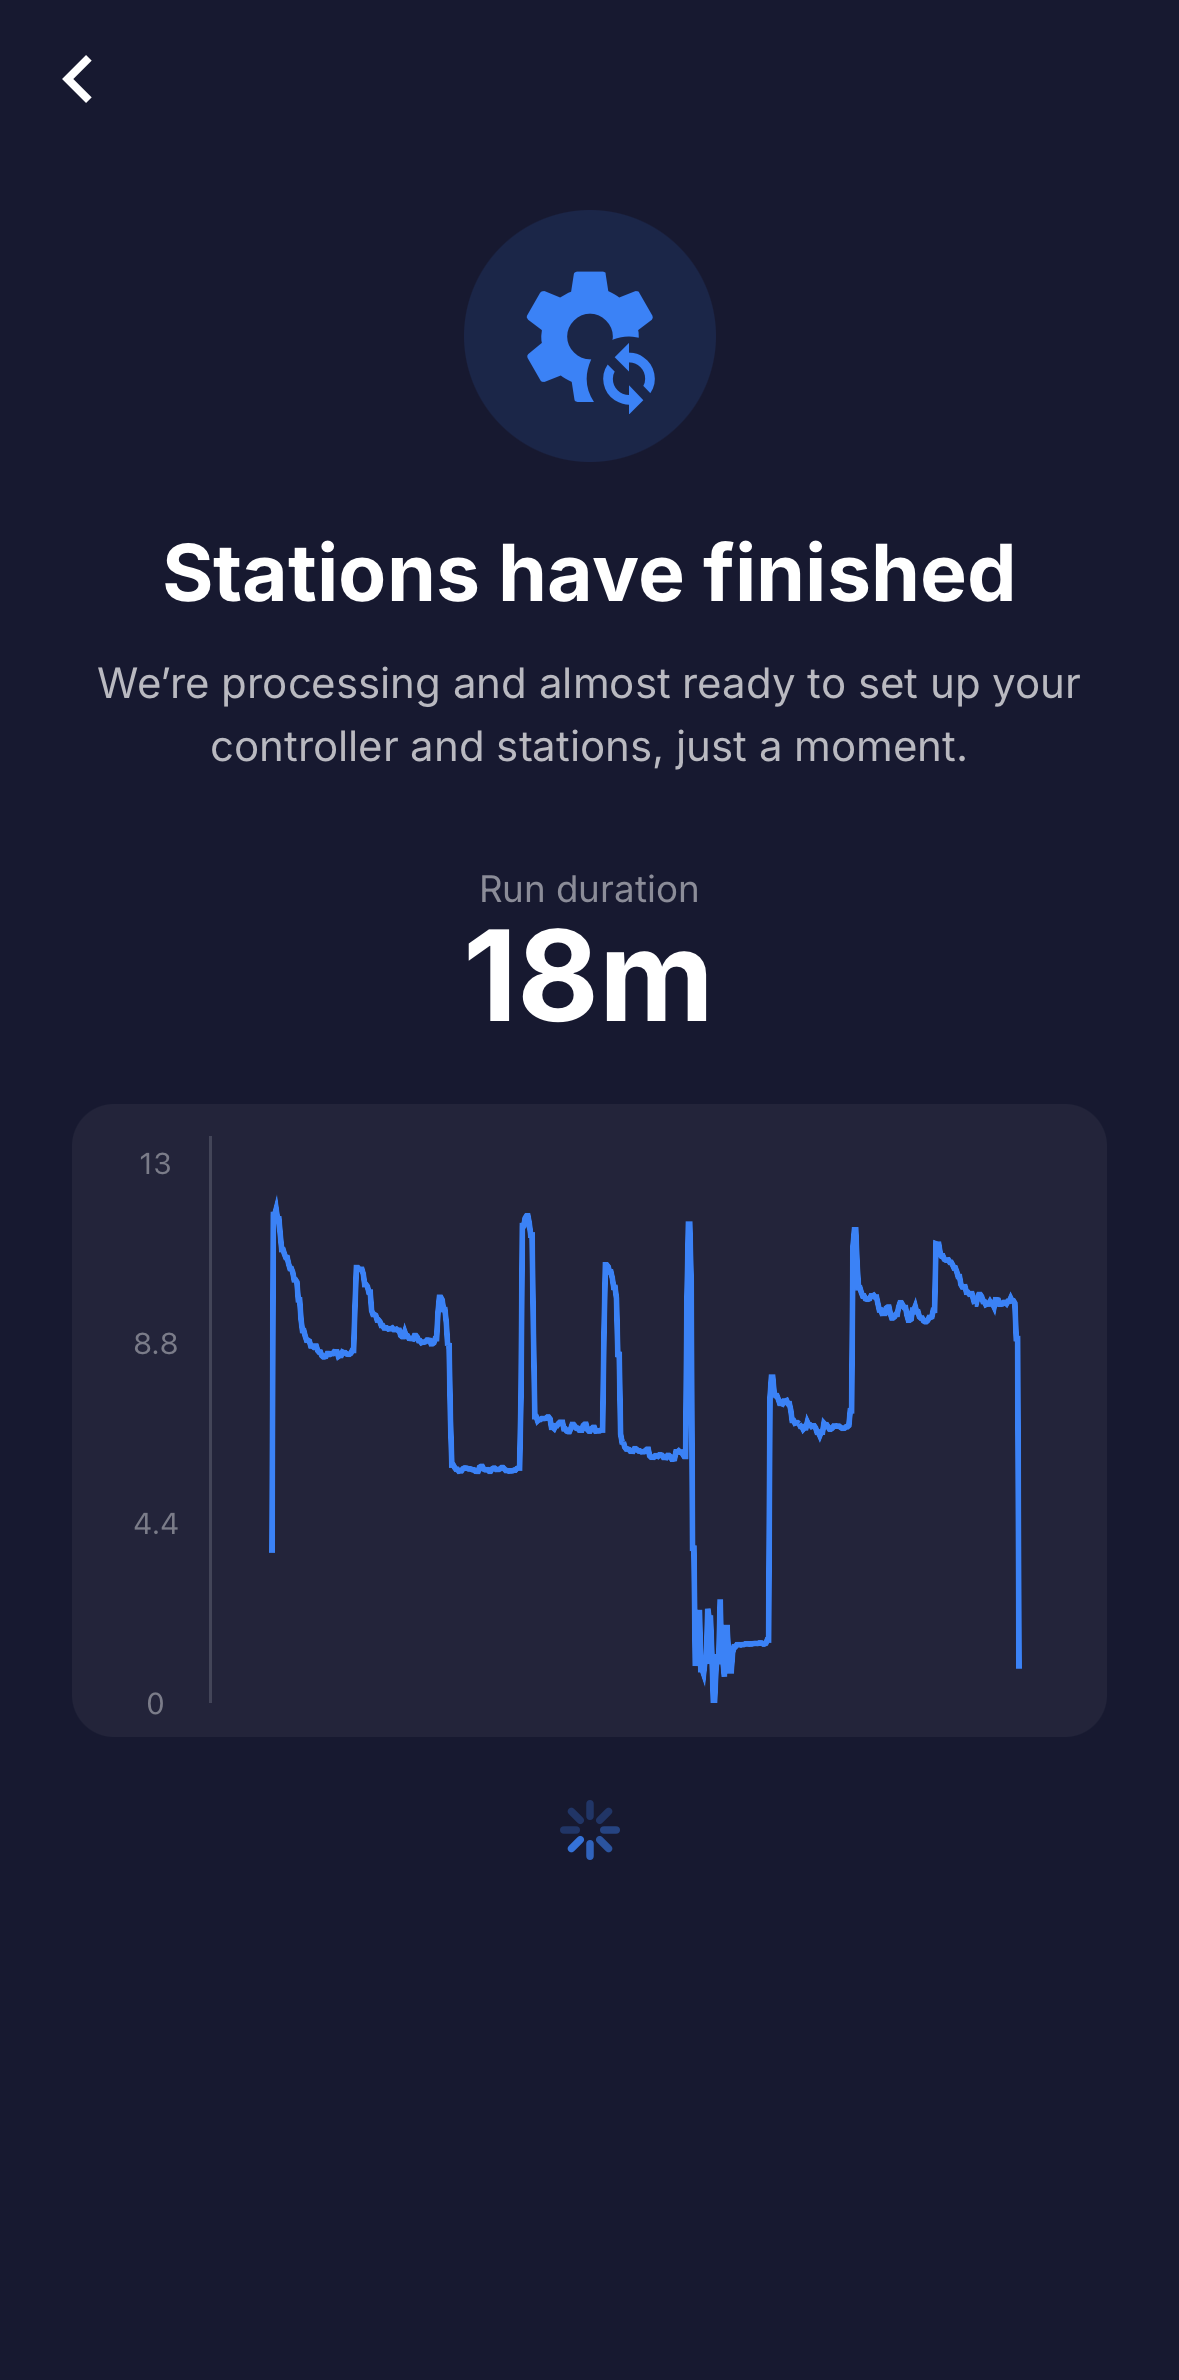
As water flows you will see "We see water flowing" and a live chart of each station. When you finish, Bluebot builds your controller from the run and pulls the flow rate for each station.
 "We see water flowing," live chart during the run.
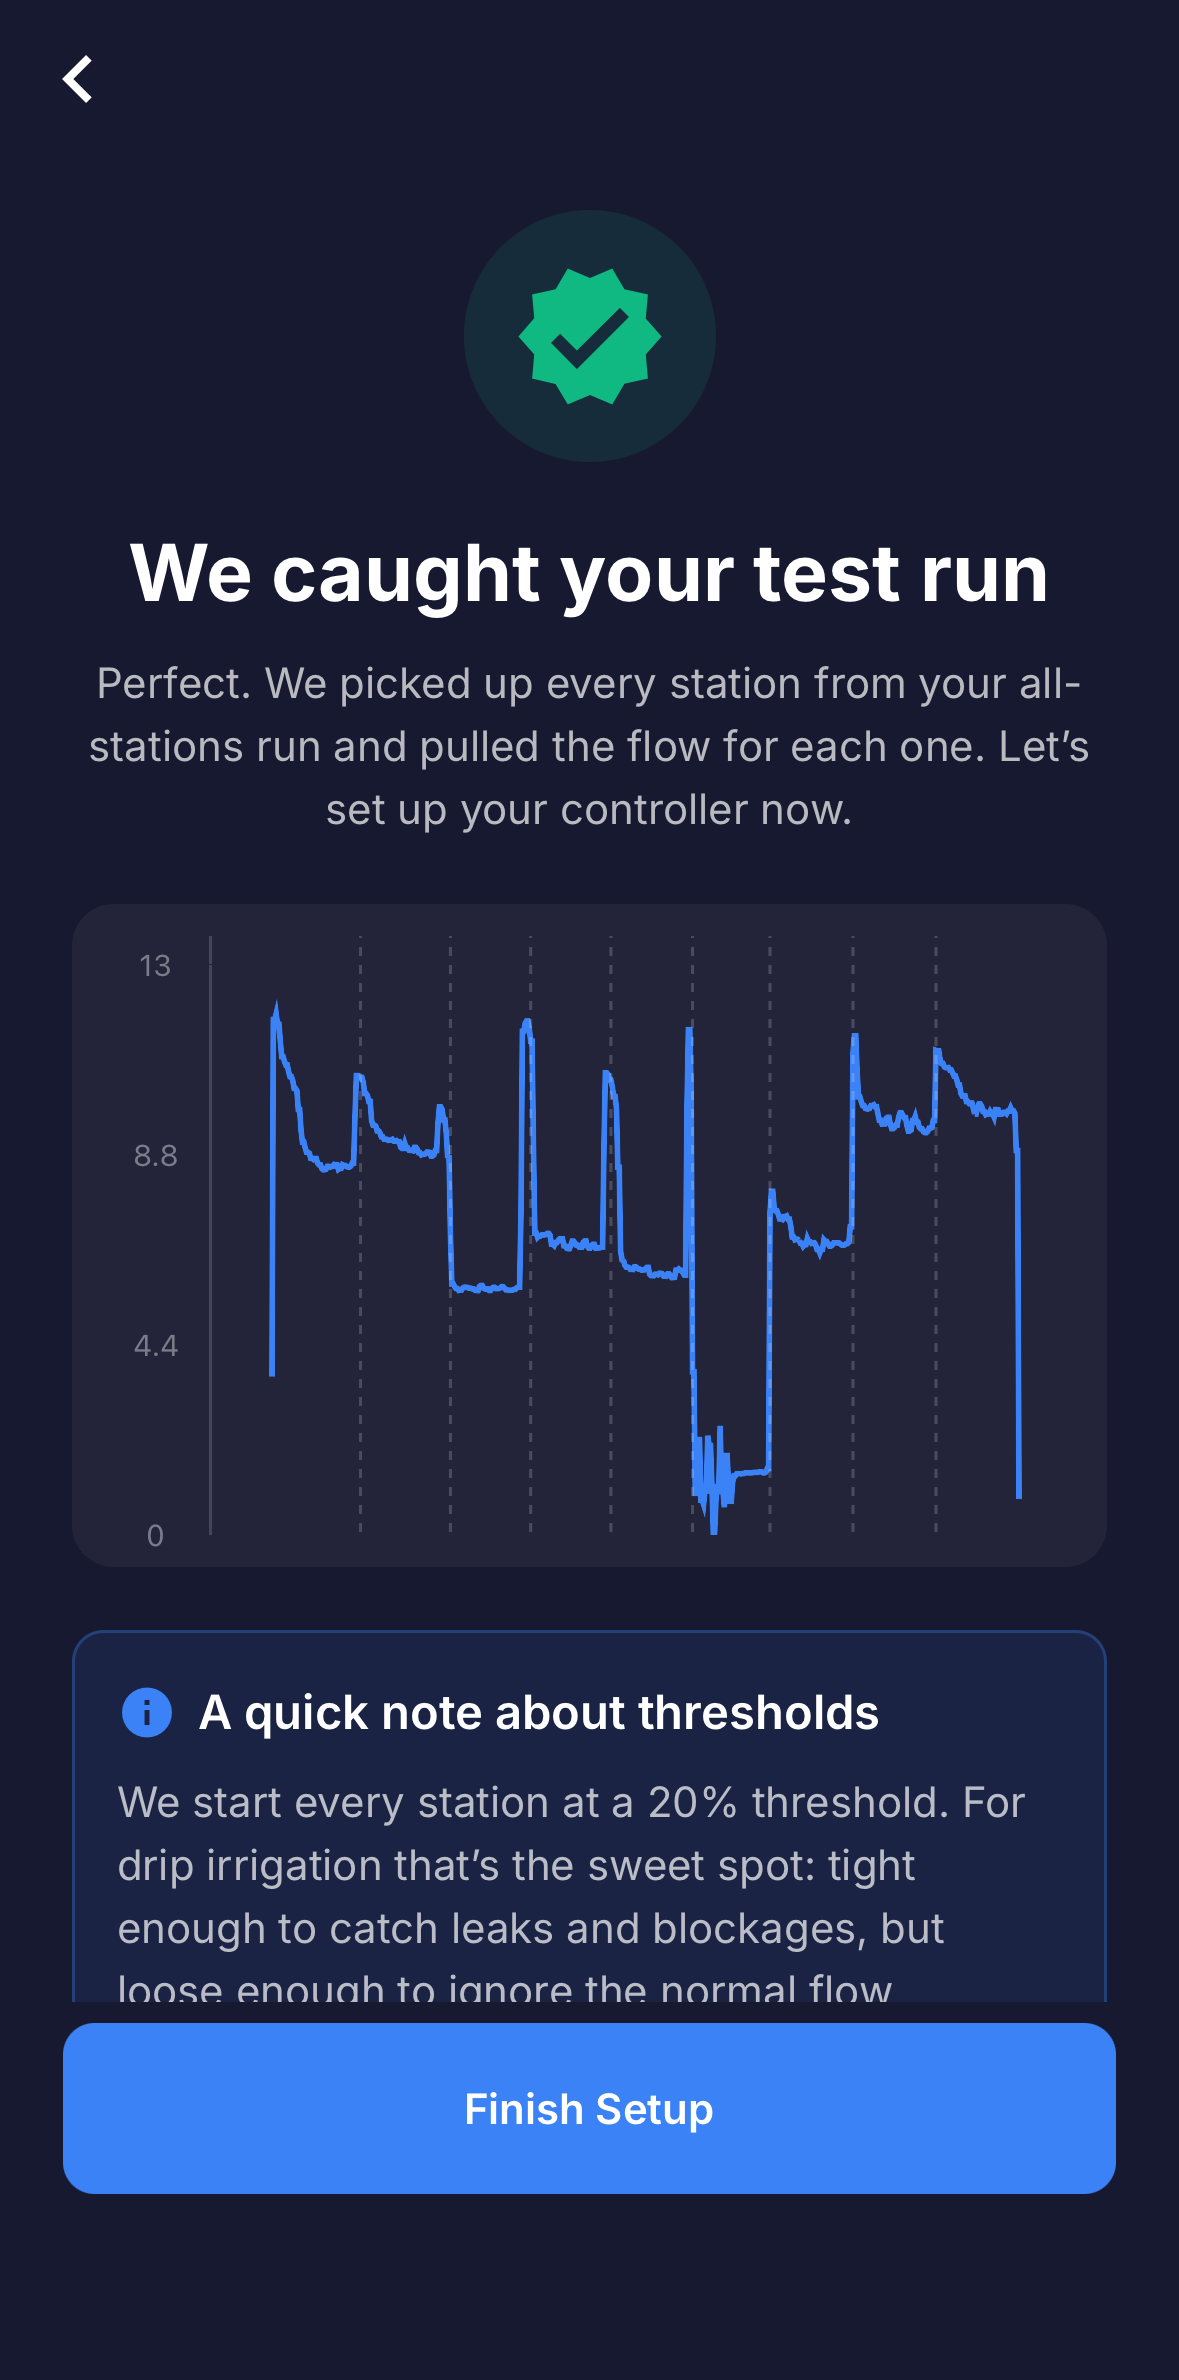 "We caught your test run," just before controller setup.
4. Confirm your controller
Give your controller a name or location, then review the detected stations. You can rename each one and adjust its average flow rate. Tap a station to expand it and set its upper and lower threshold.
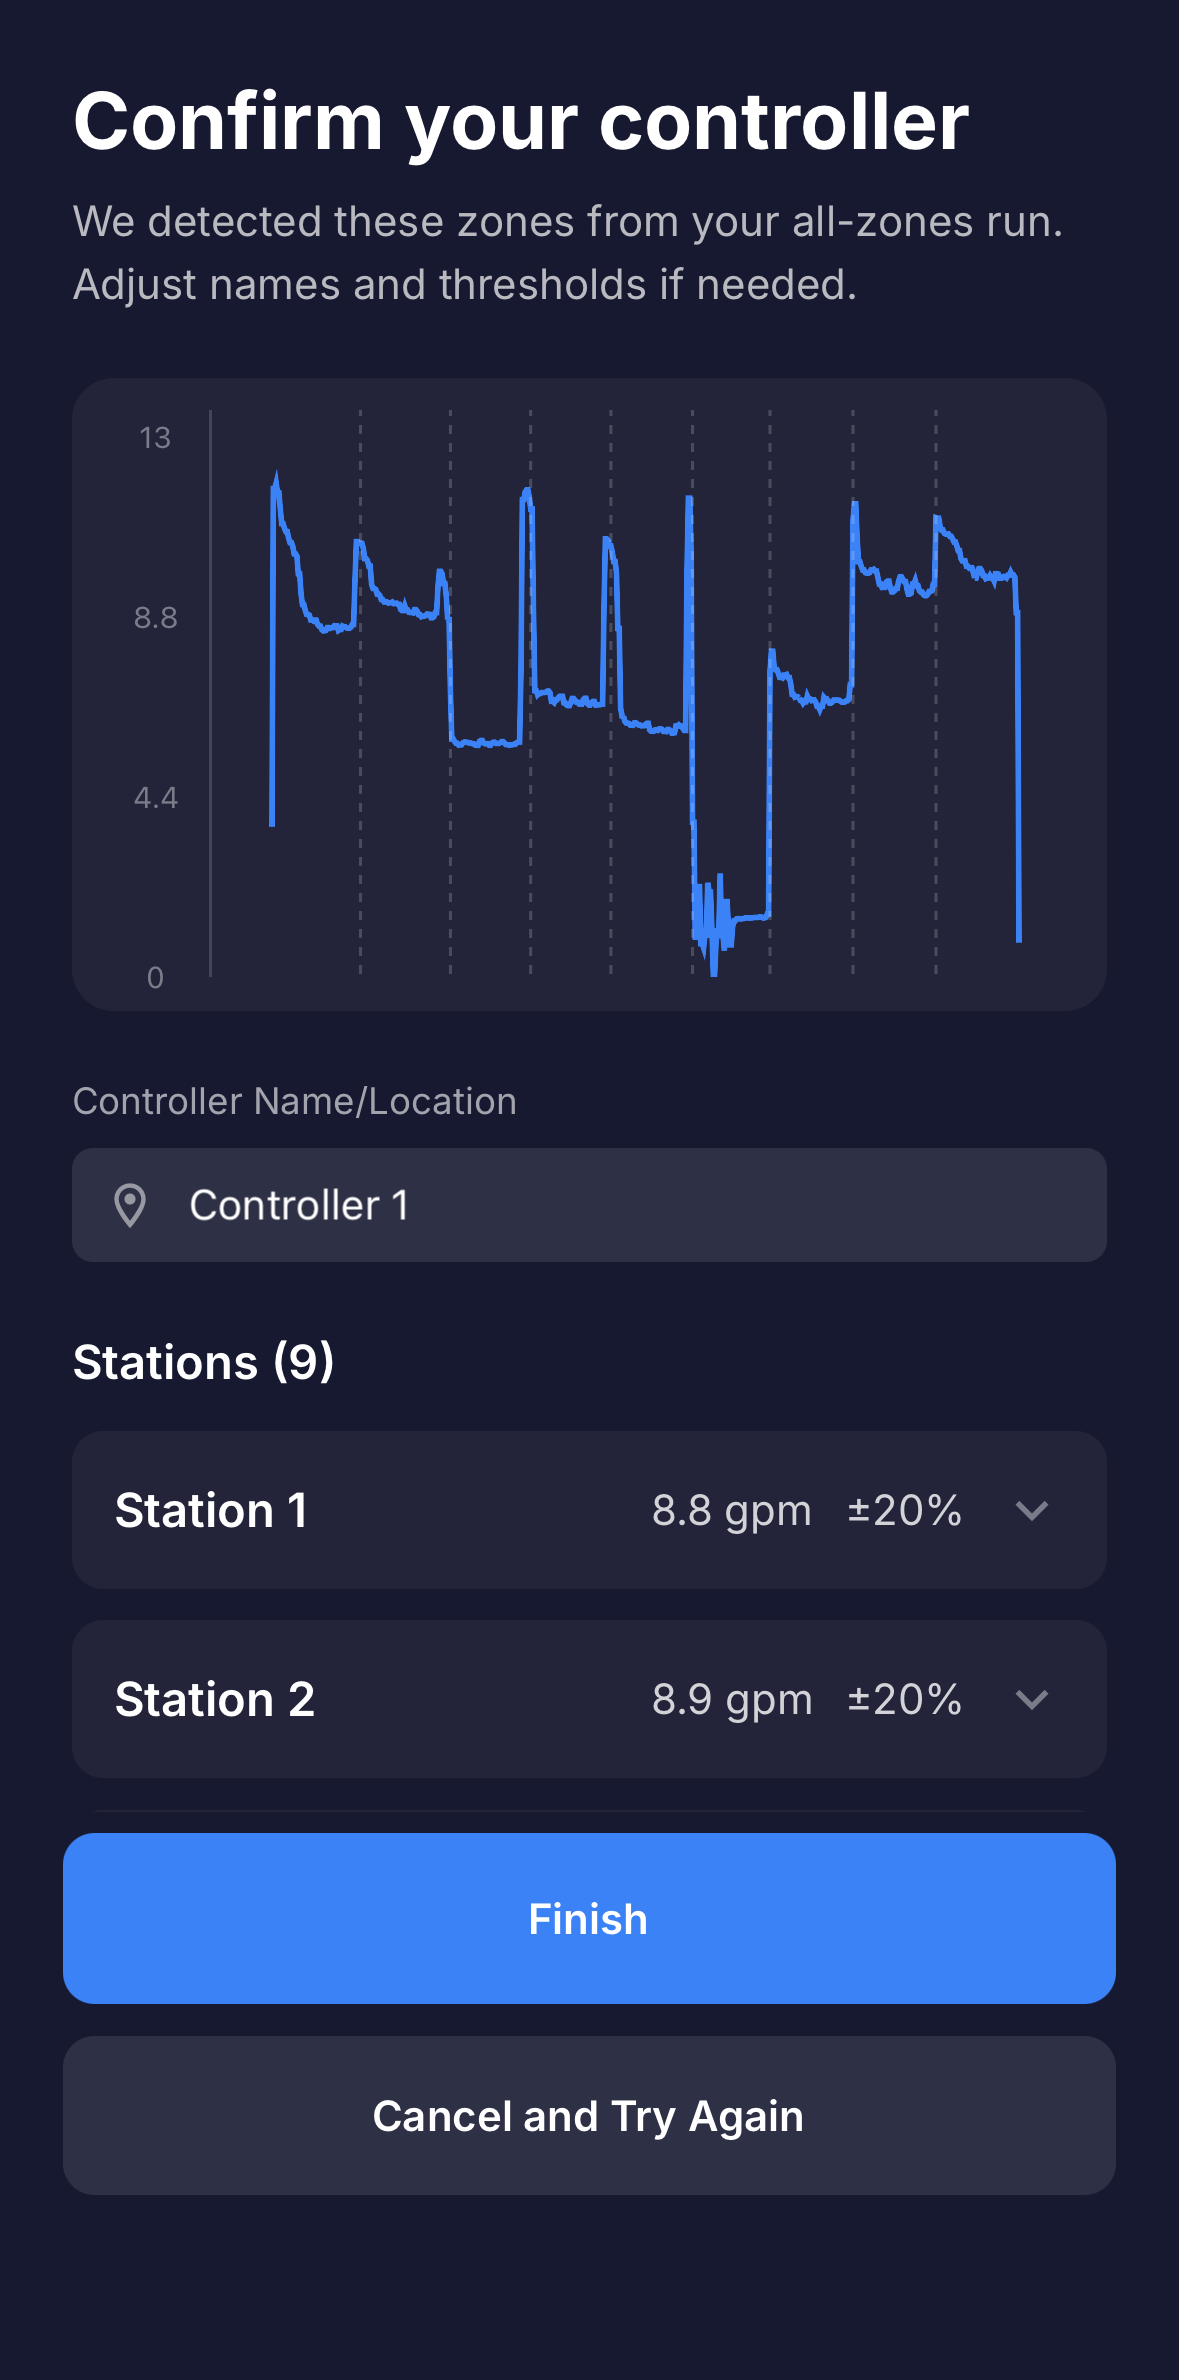 "Confirm your controller" with the detected stations.
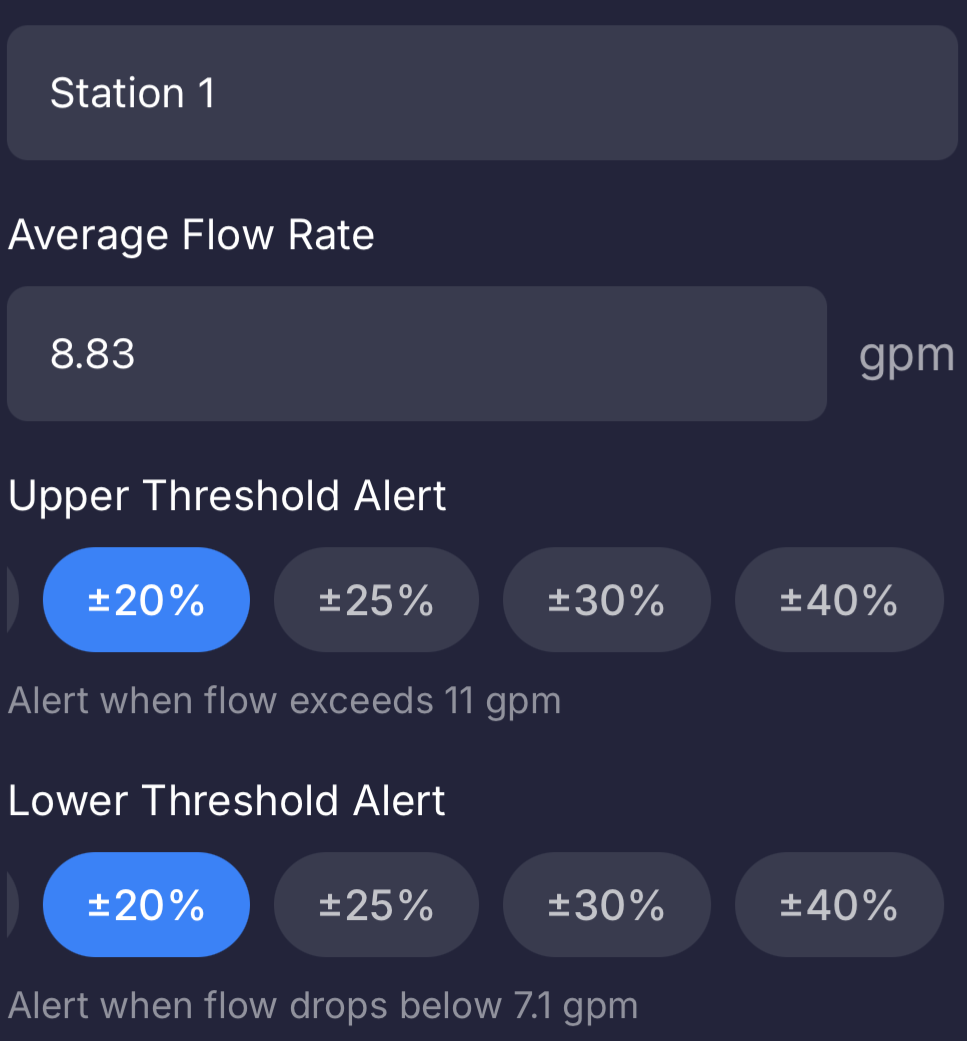 A single expanded station card with name, flow rate, and thresholds.
5. Add another controller (if you have one)
Some systems use more than one controller. If you have another, choose Set up another and run all its stations the same way. Otherwise choose I'm done with setup.
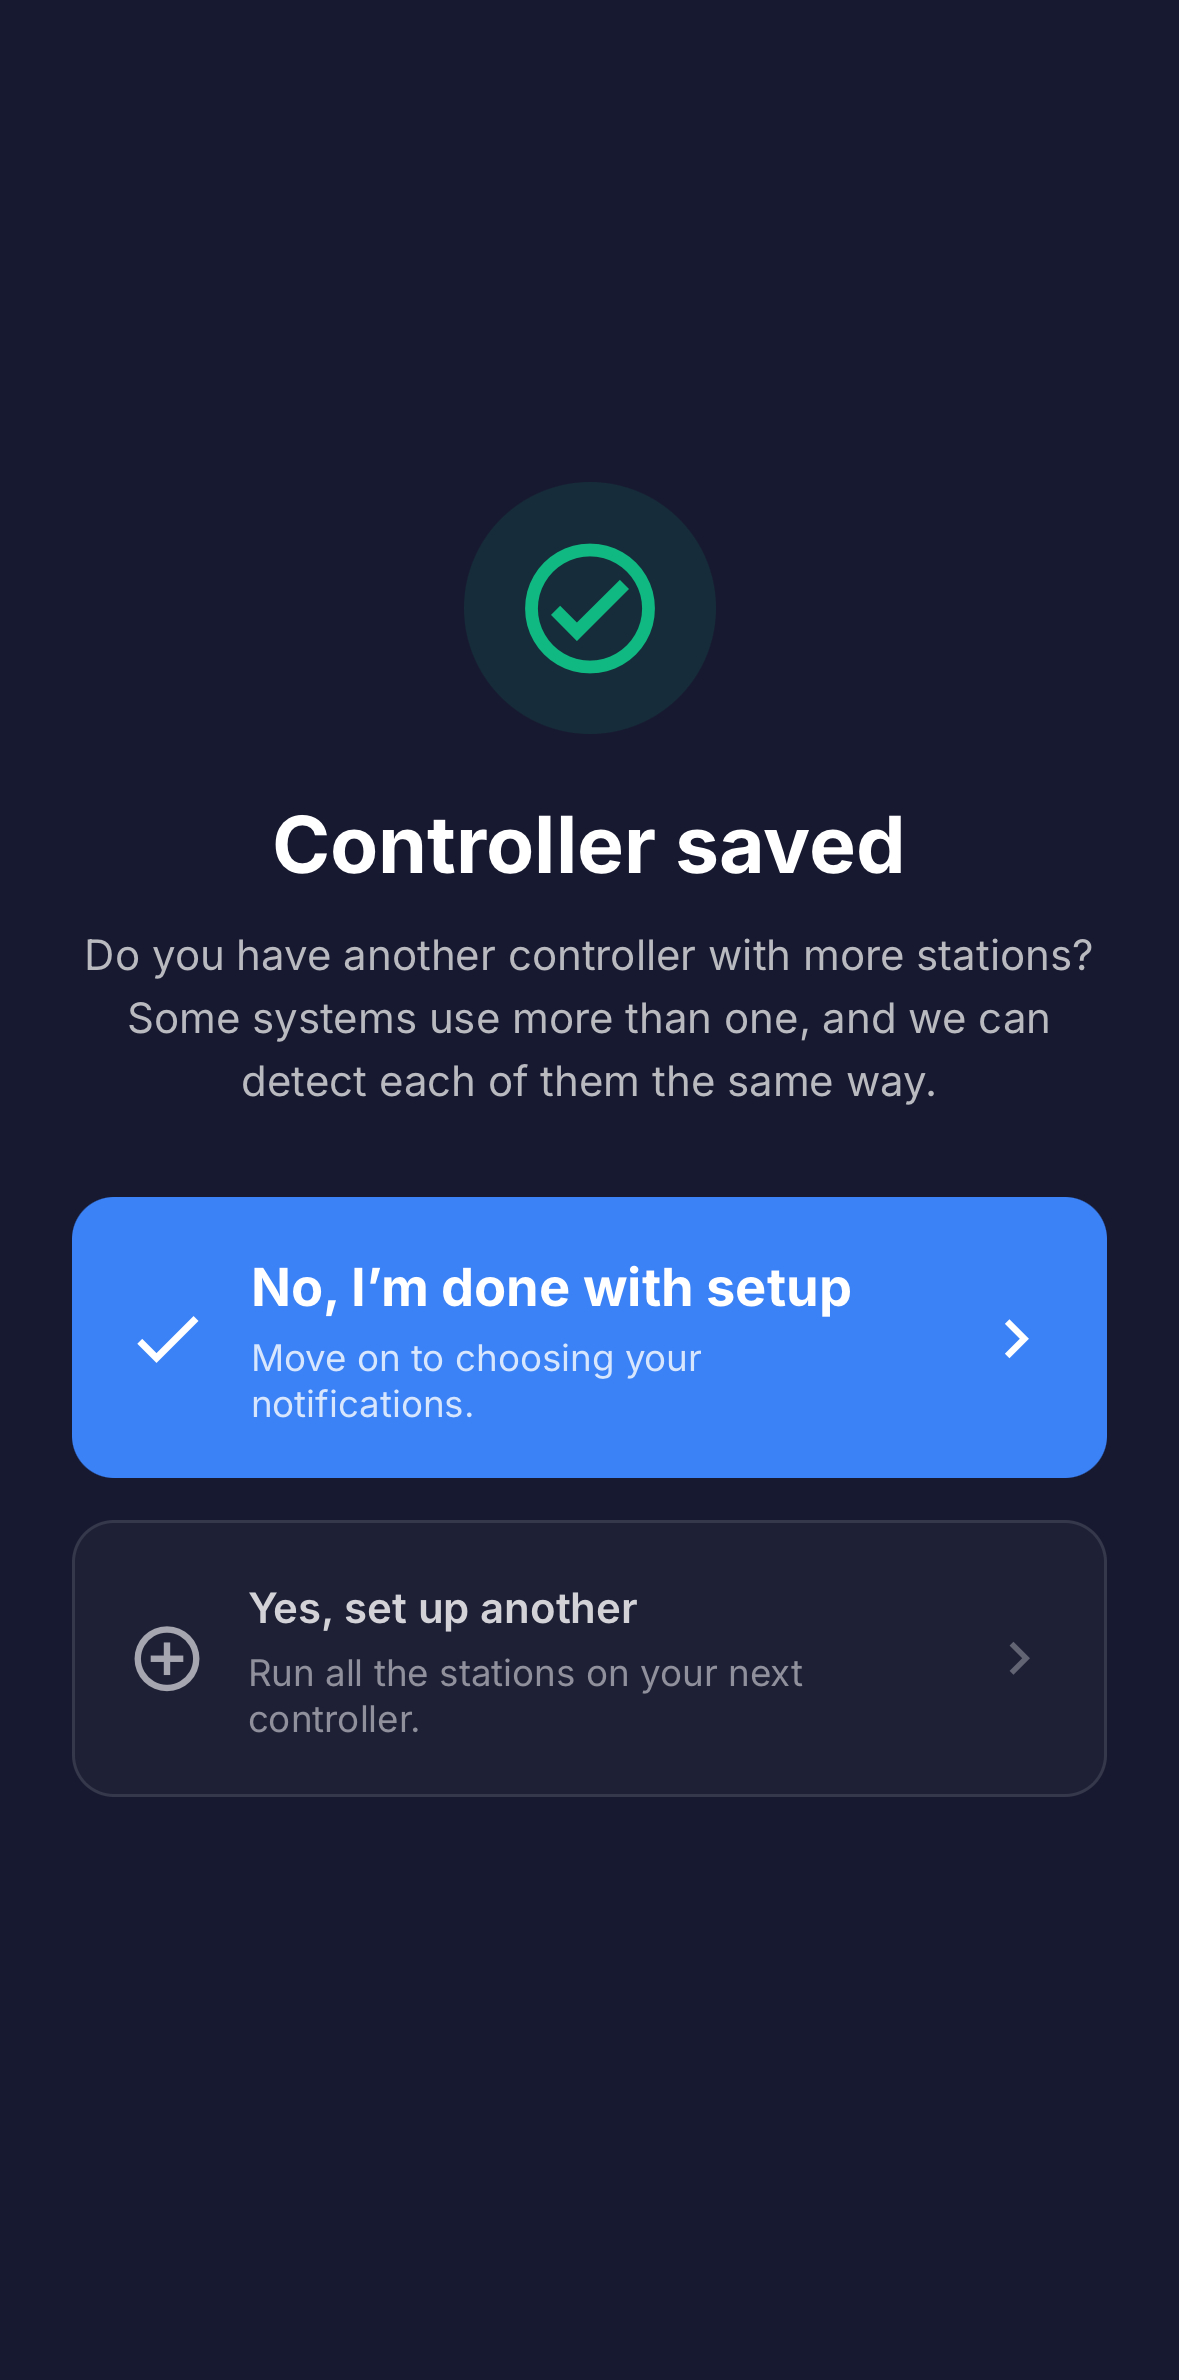 "Controller saved," asking about additional controllers.
6. Set up notifications
The last step is a short wizard titled "Let's set up your notifications." Each alert is a simple on/off toggle, and they all start on. The toggles are grouped into two screens: Routine program updates (Program Start and Program End, for normal scheduled watering) and When something looks off (Manual Watering Started and Ended, New Program Detected, and Threshold Breach). On the last screen, Who should we text?, you pick who gets the alerts. You can change all of this later in Settings. When you finish, the dashboard switches to live monitoring.
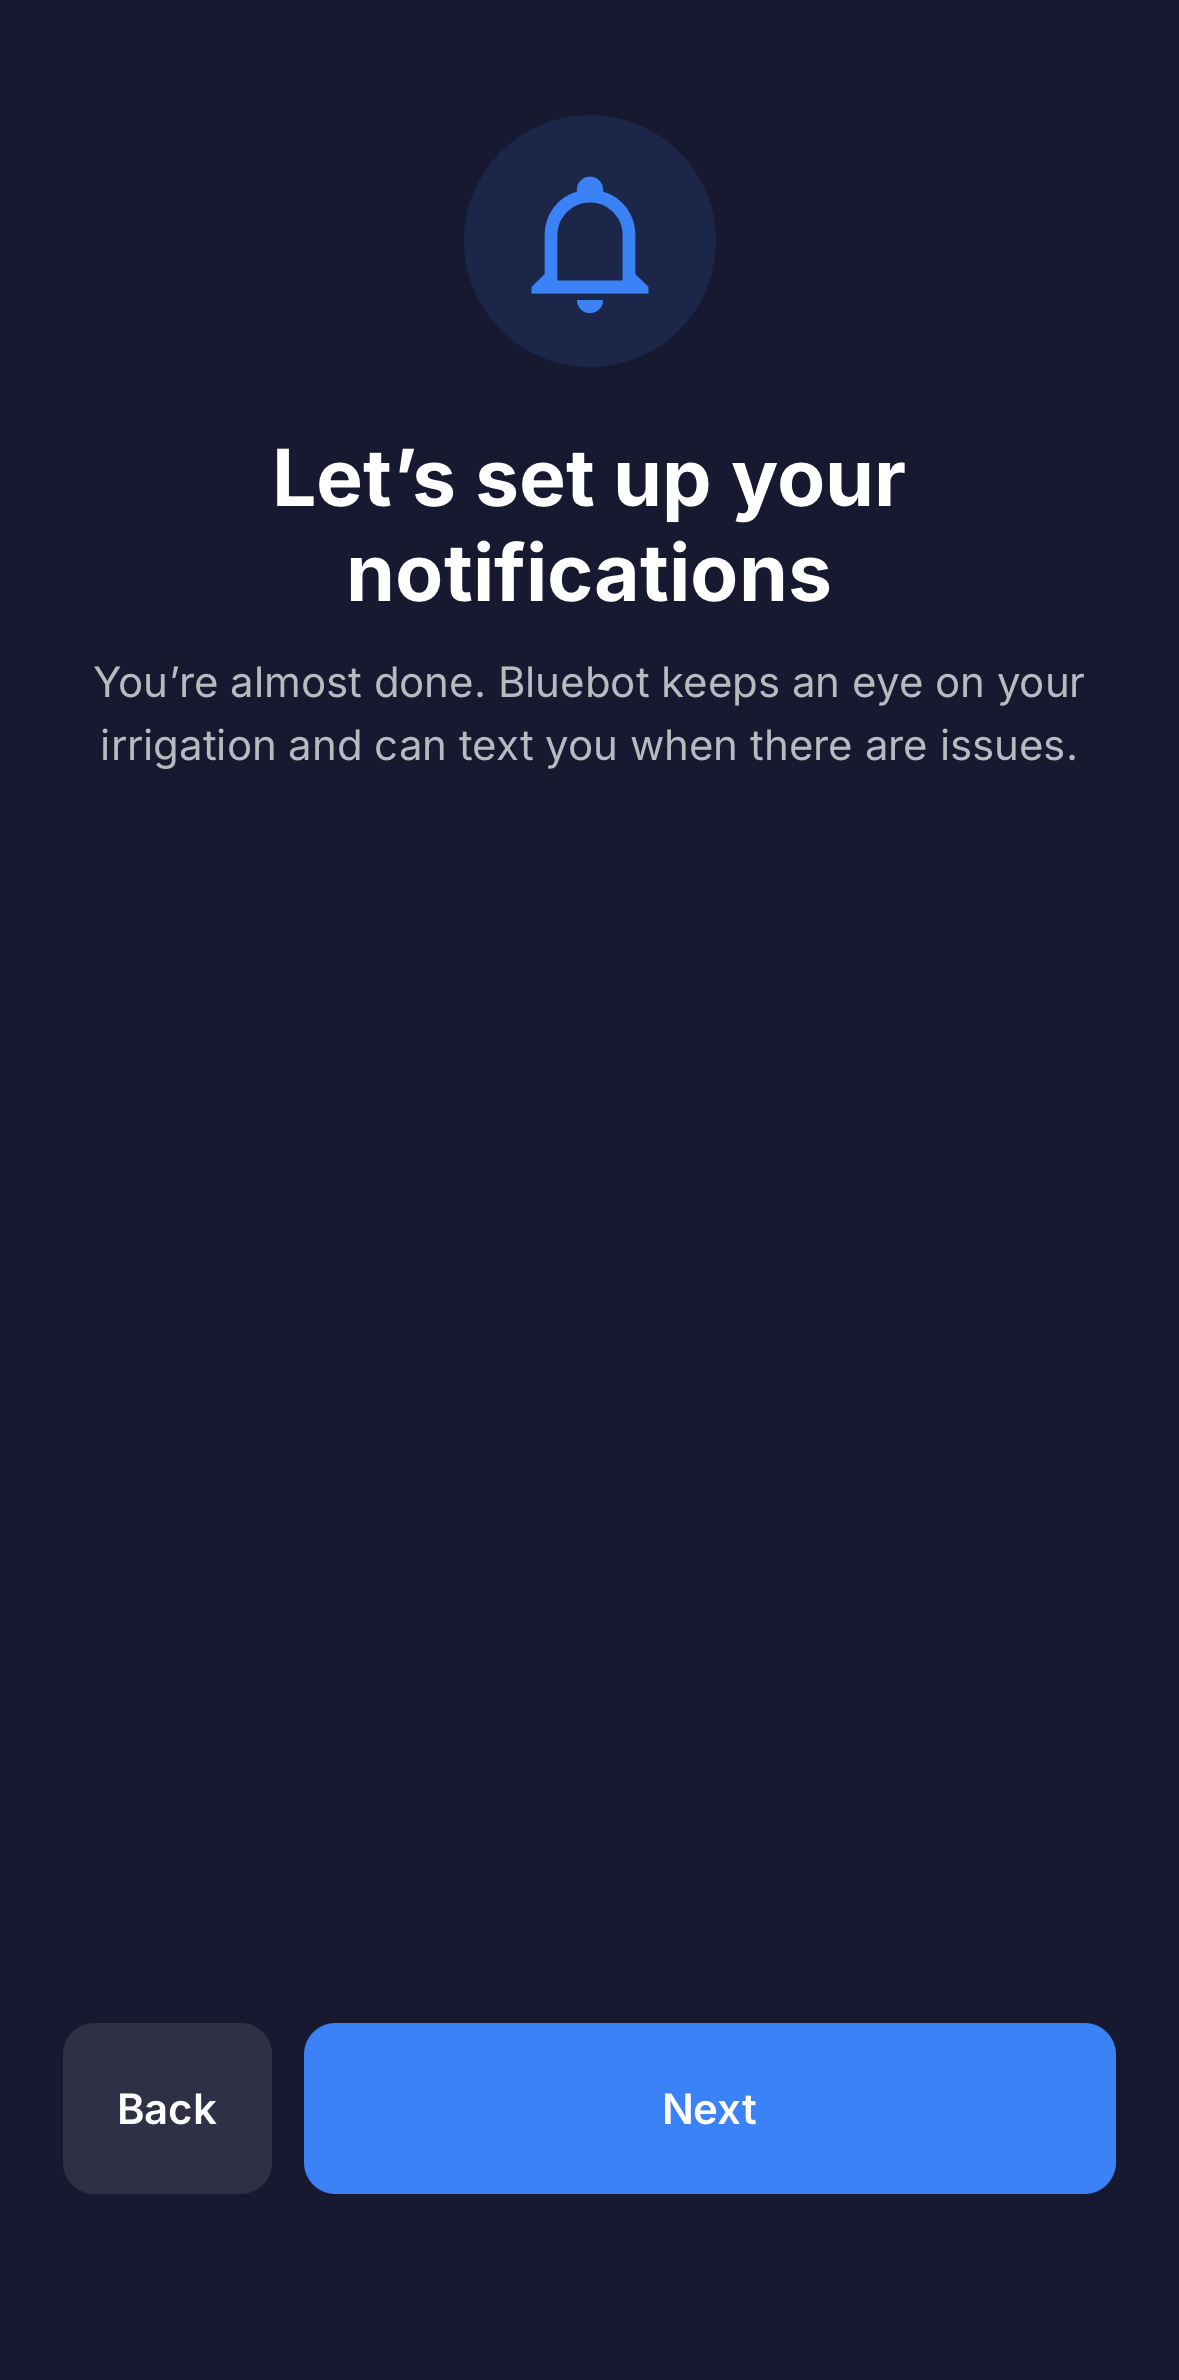 "Let's set up your notifications," the wizard intro.
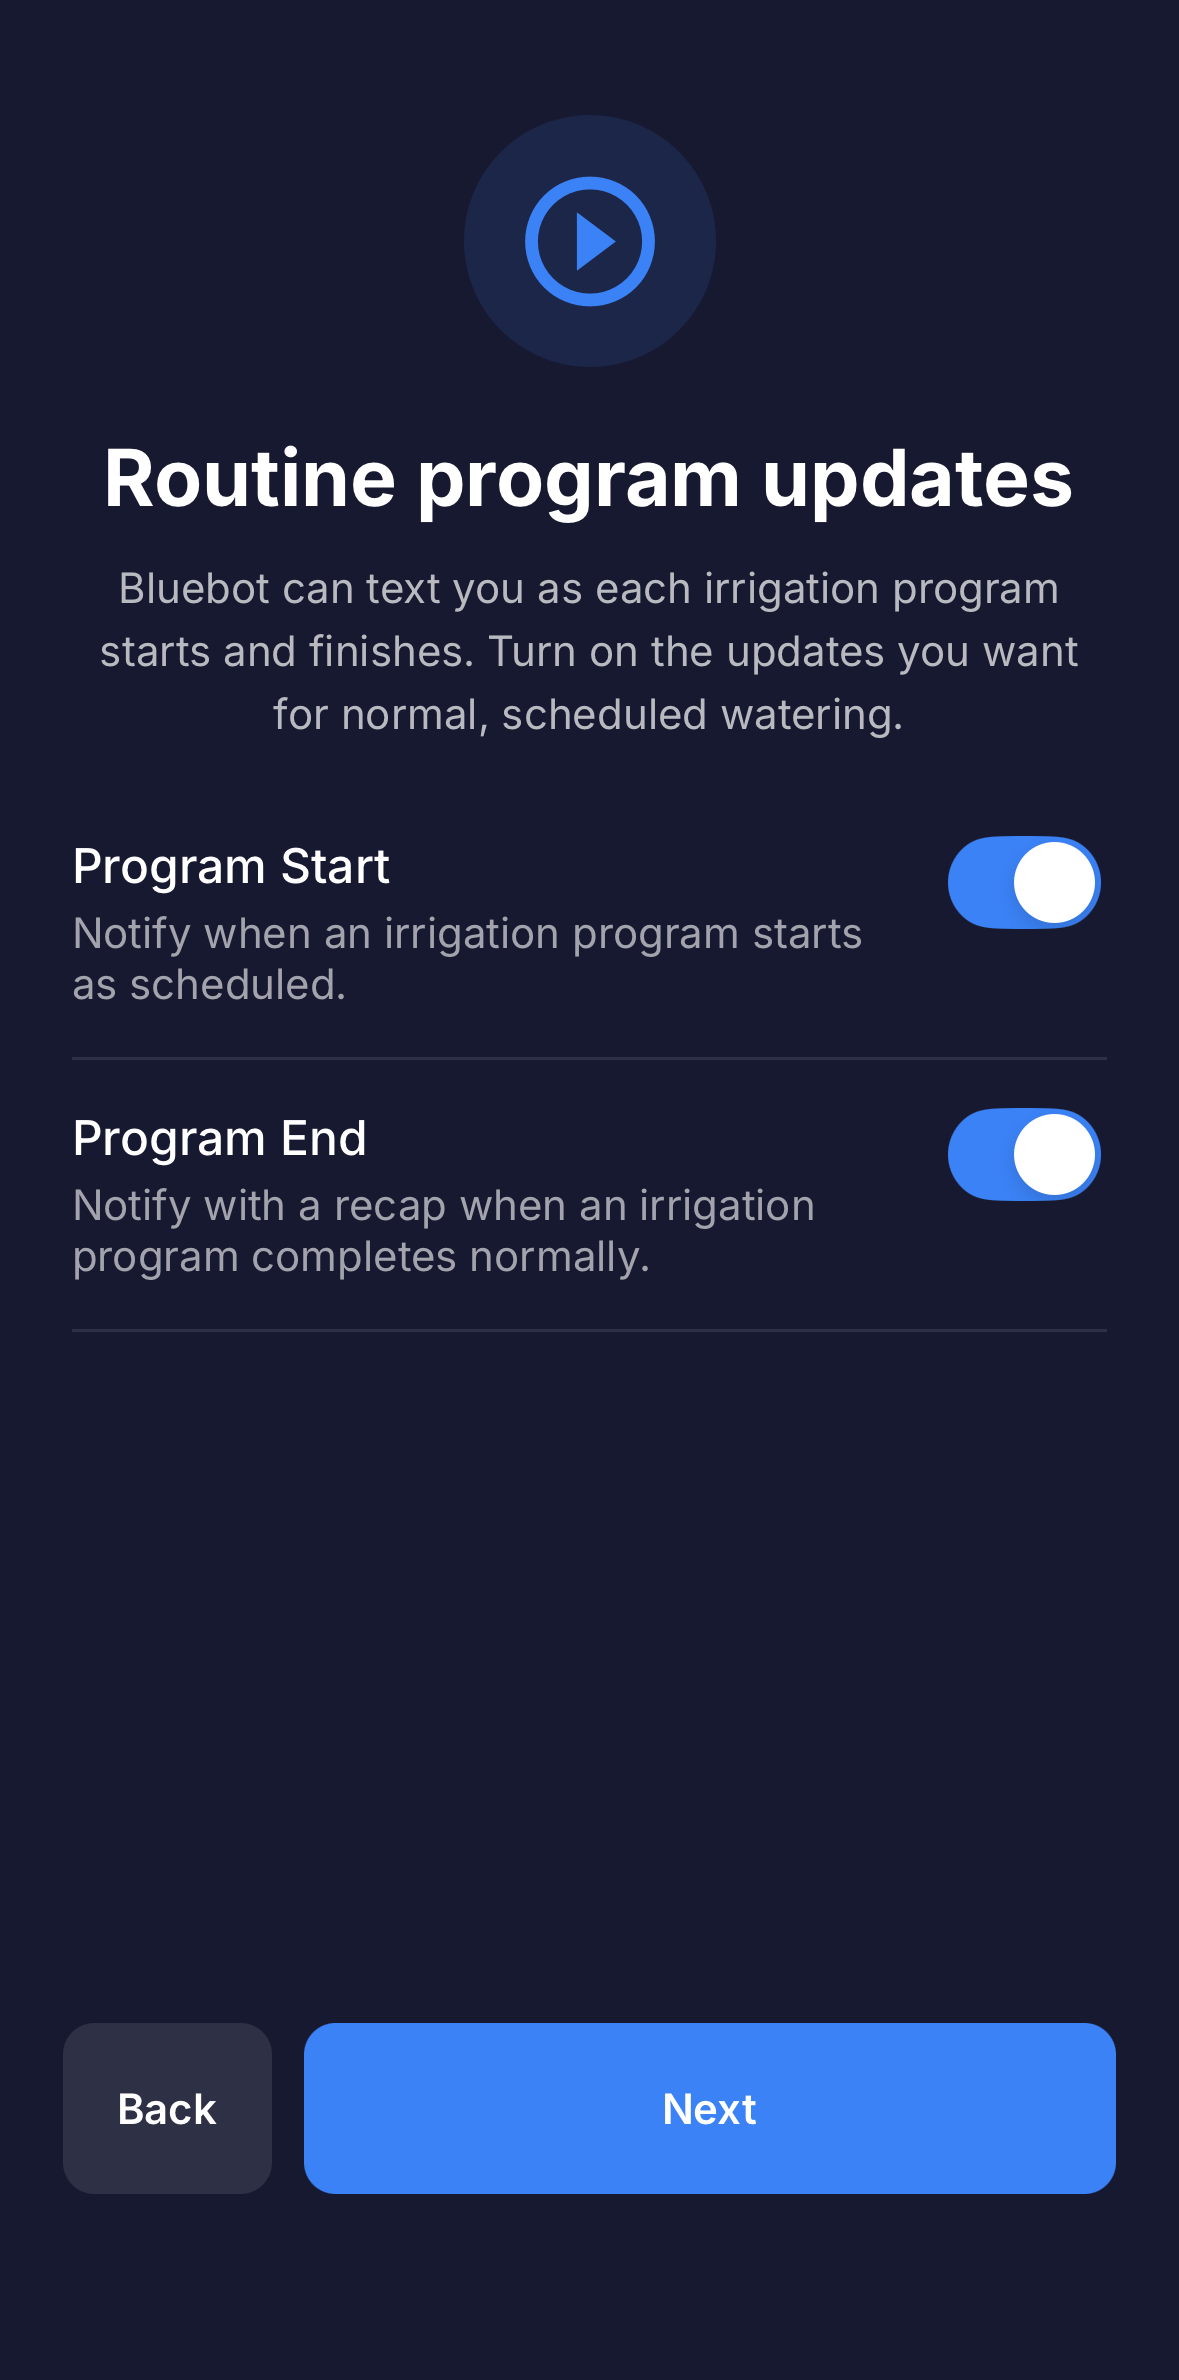 "Routine program updates," Program Start and End toggles.
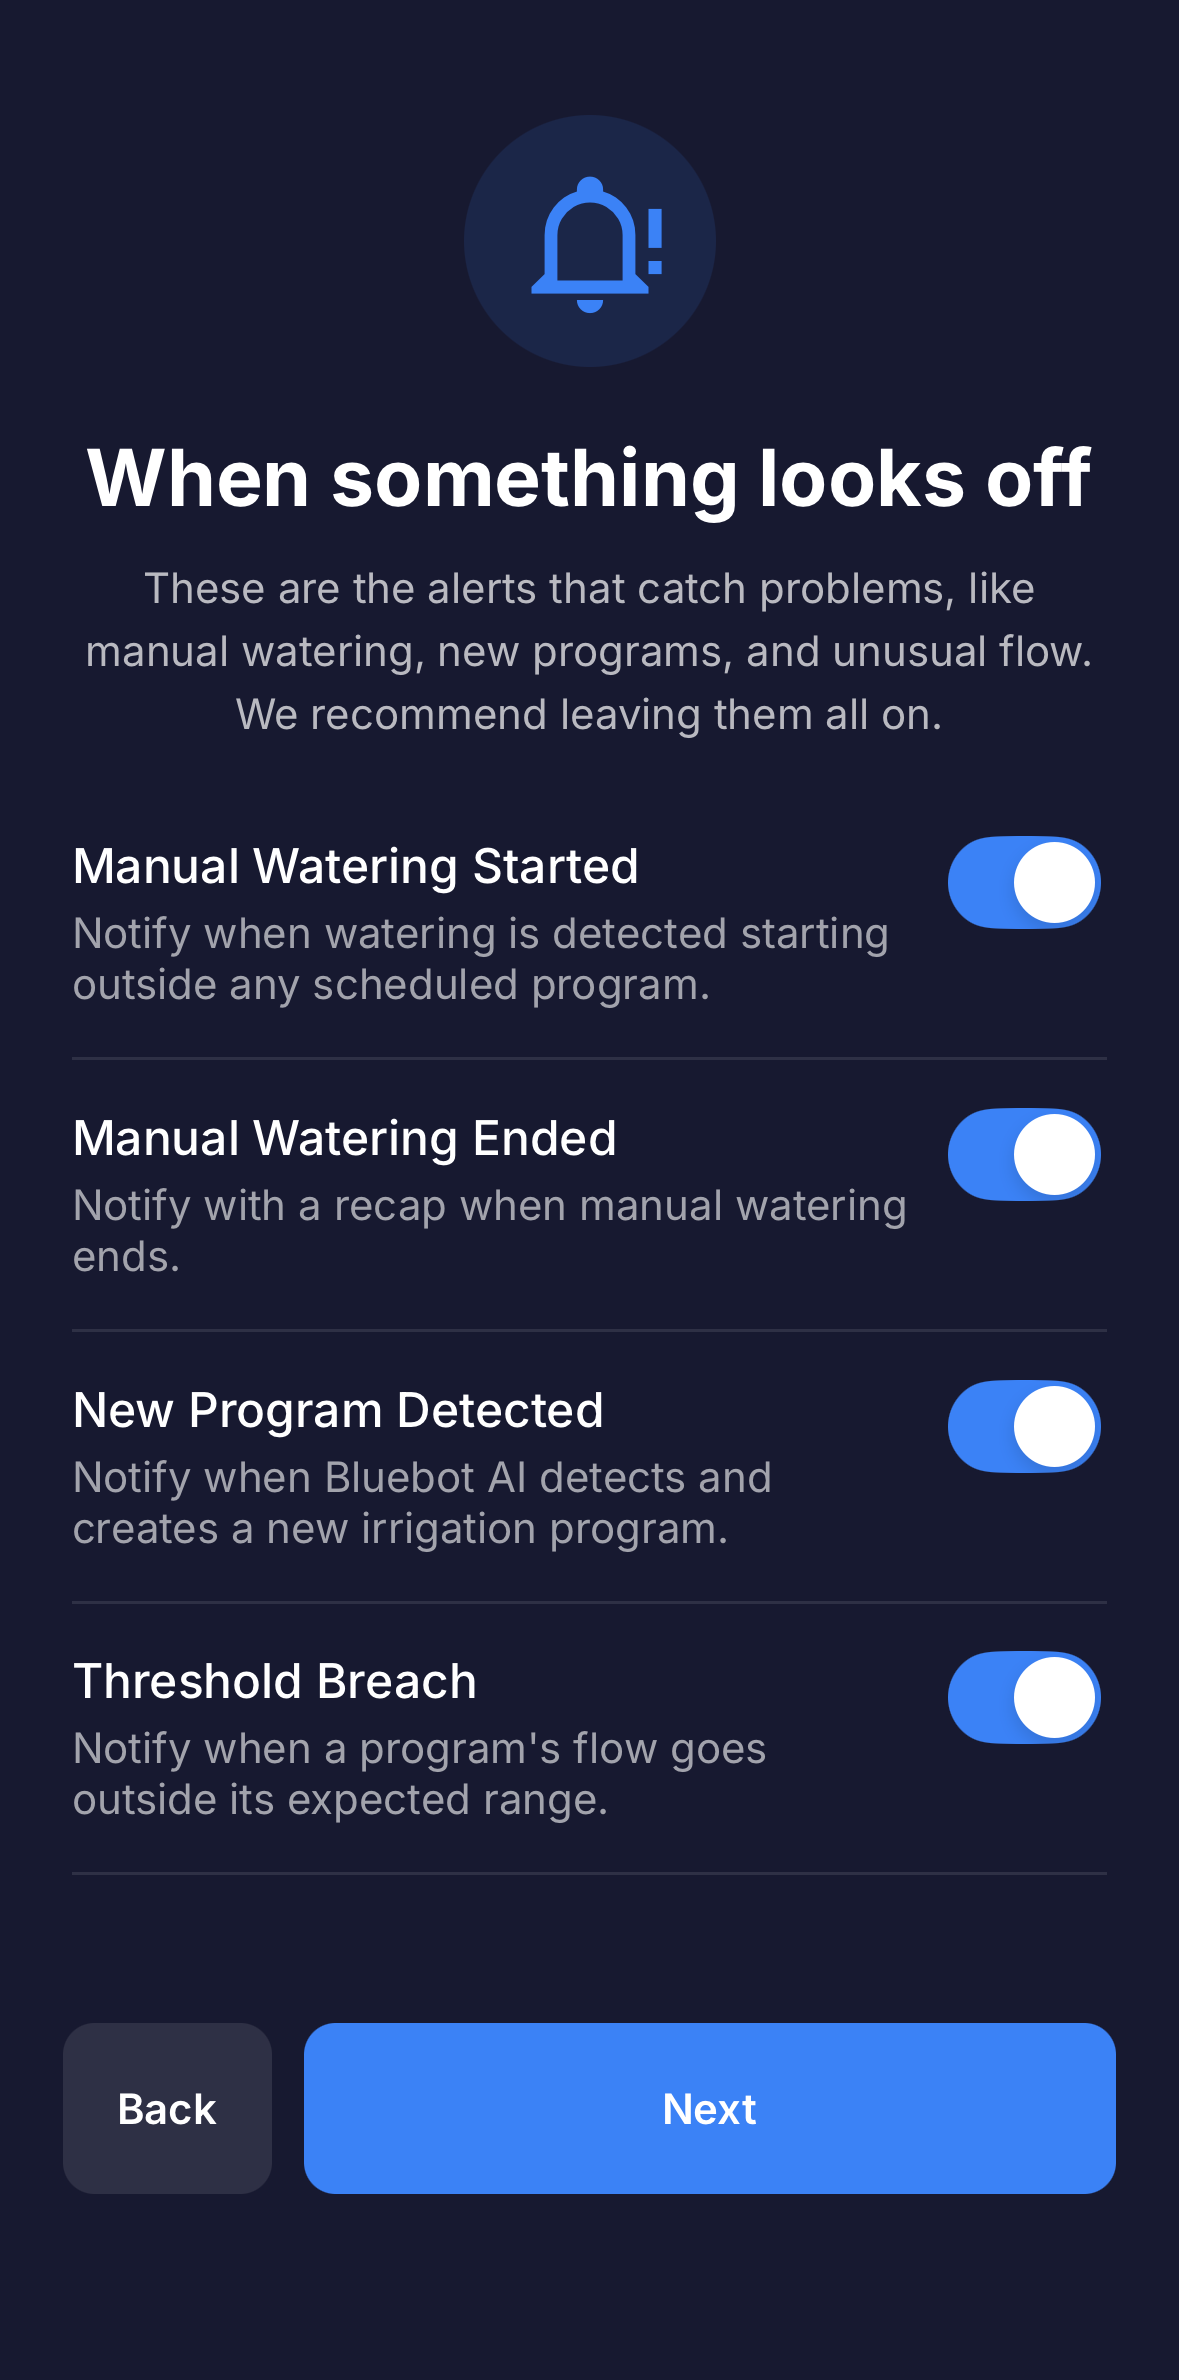 "When something looks off," the problem alerts.
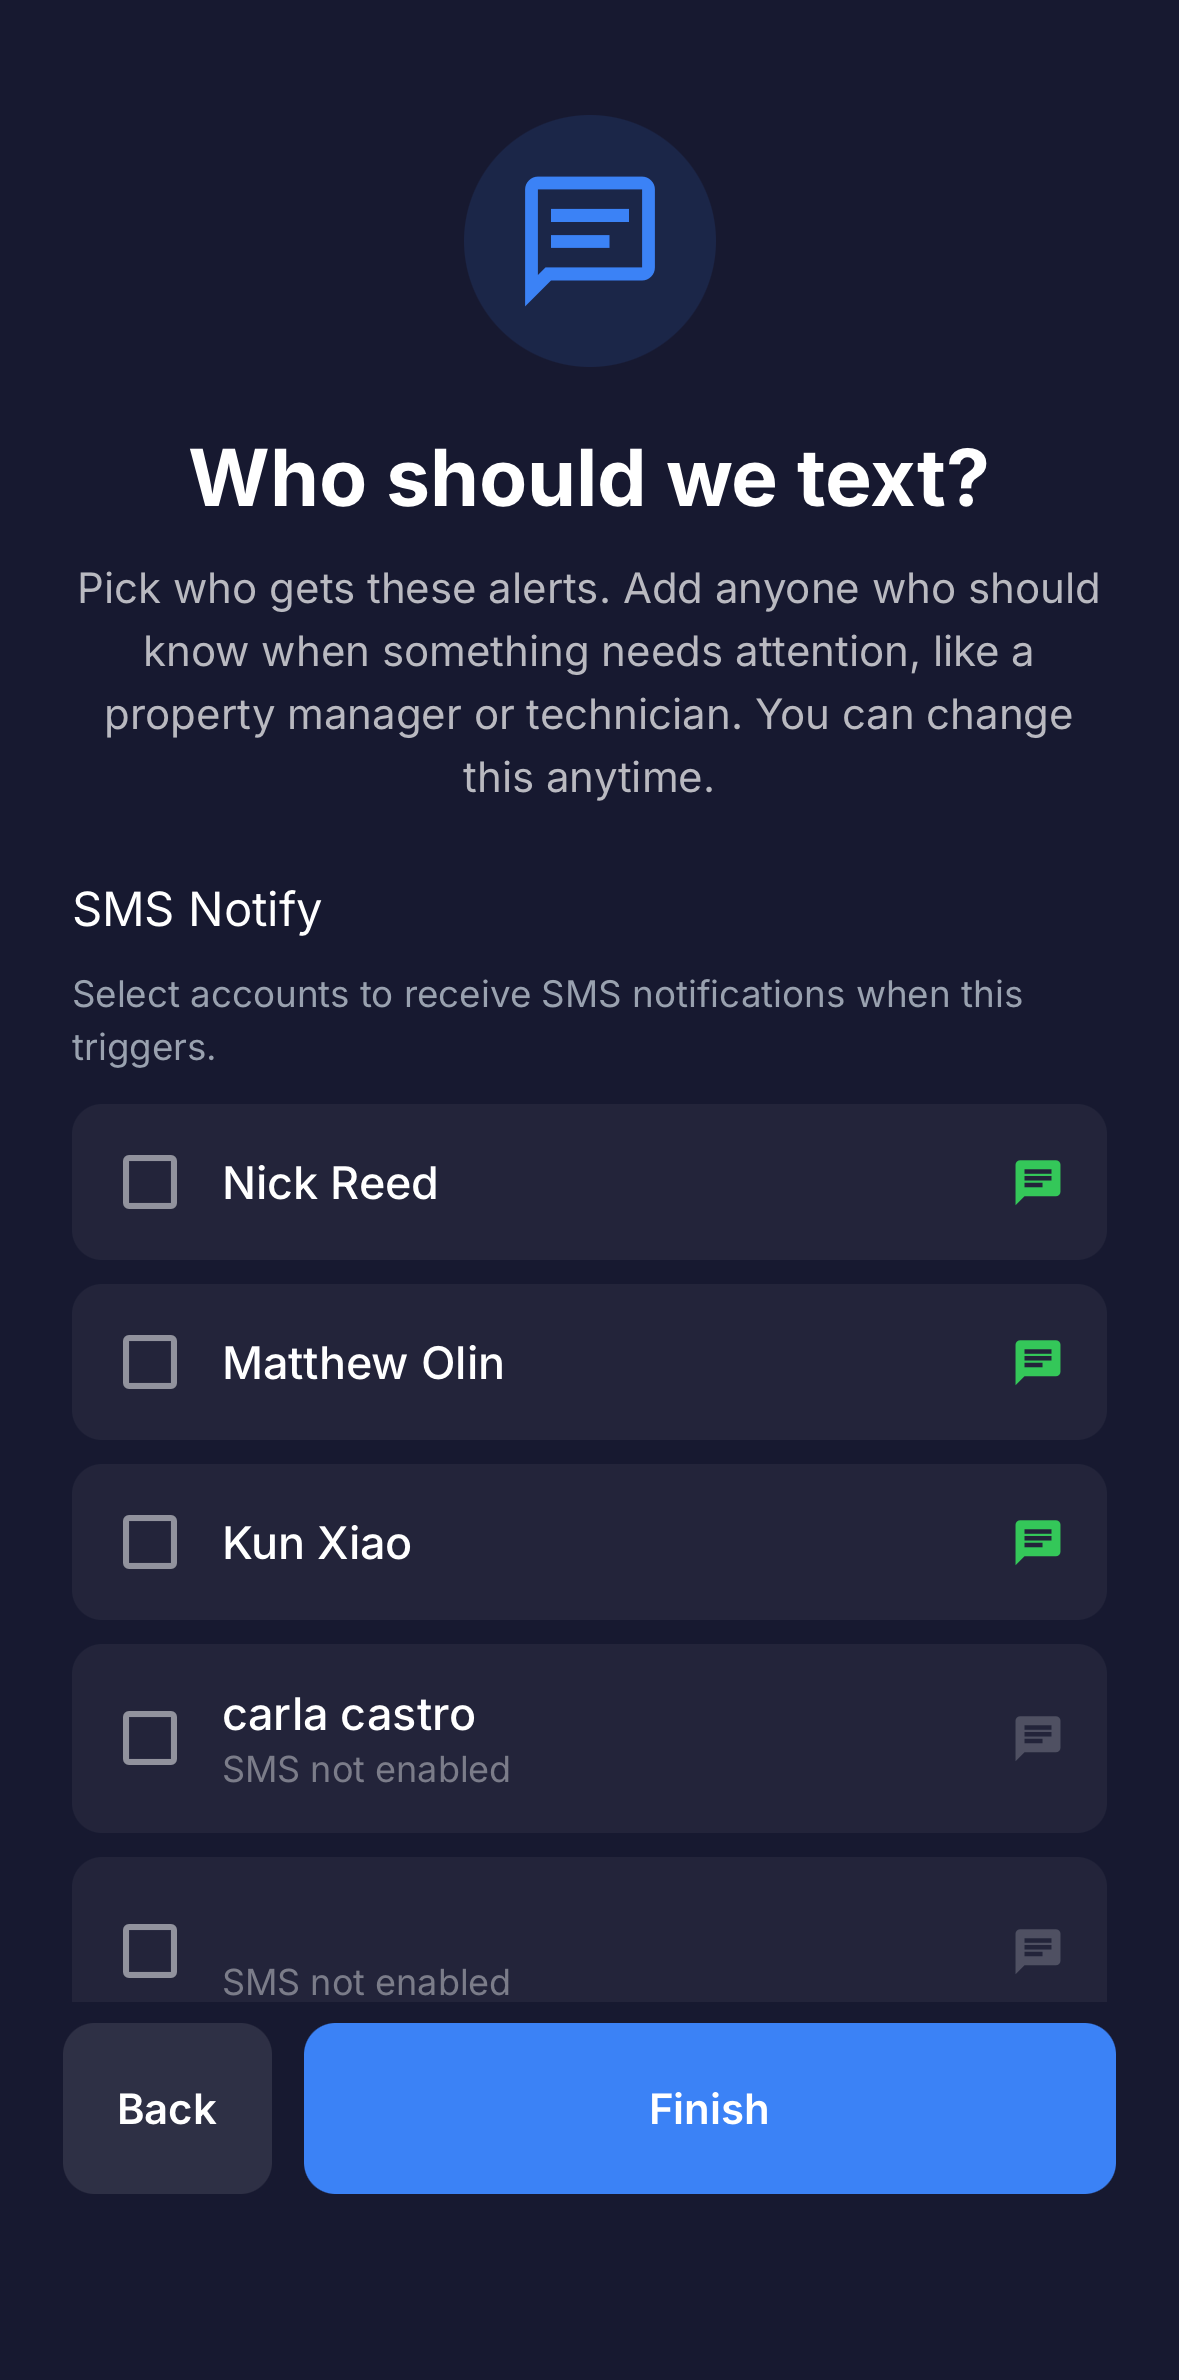 "Who should we text?" recipients.
7. Let Bluebot AI learn your system
Right after setup, before any programs have run, the Irrigation tab shows that no programs have been recorded yet. Bluebot AI watches in the background and recognizes each program automatically the first time it runs, so your dashboard fills in on its own as your normal schedule plays out.
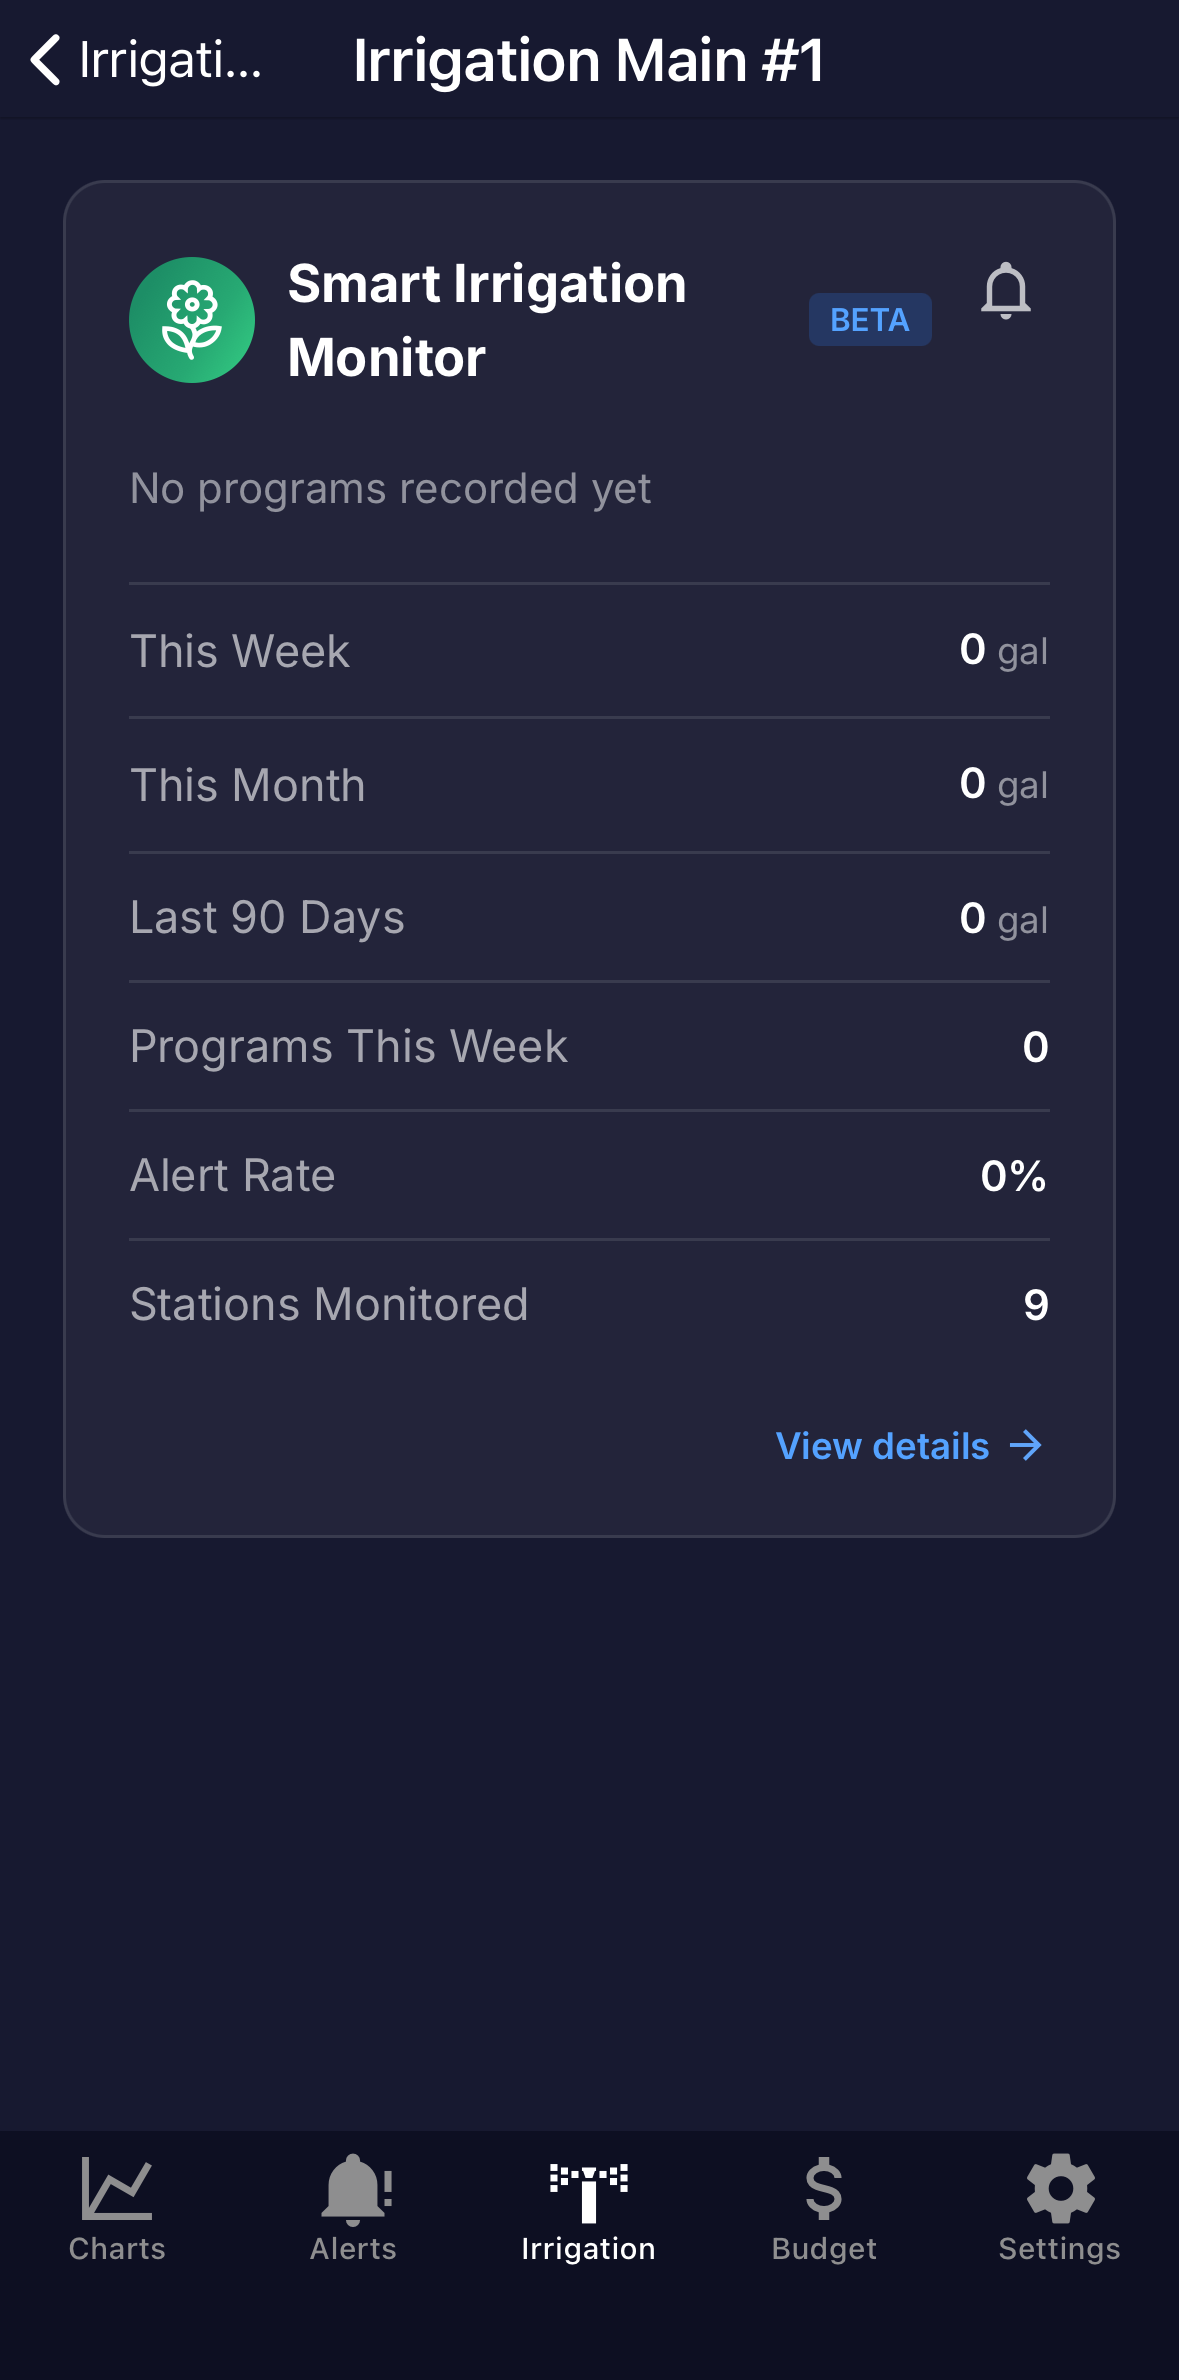 "No programs recorded yet" on the Irrigation tab.
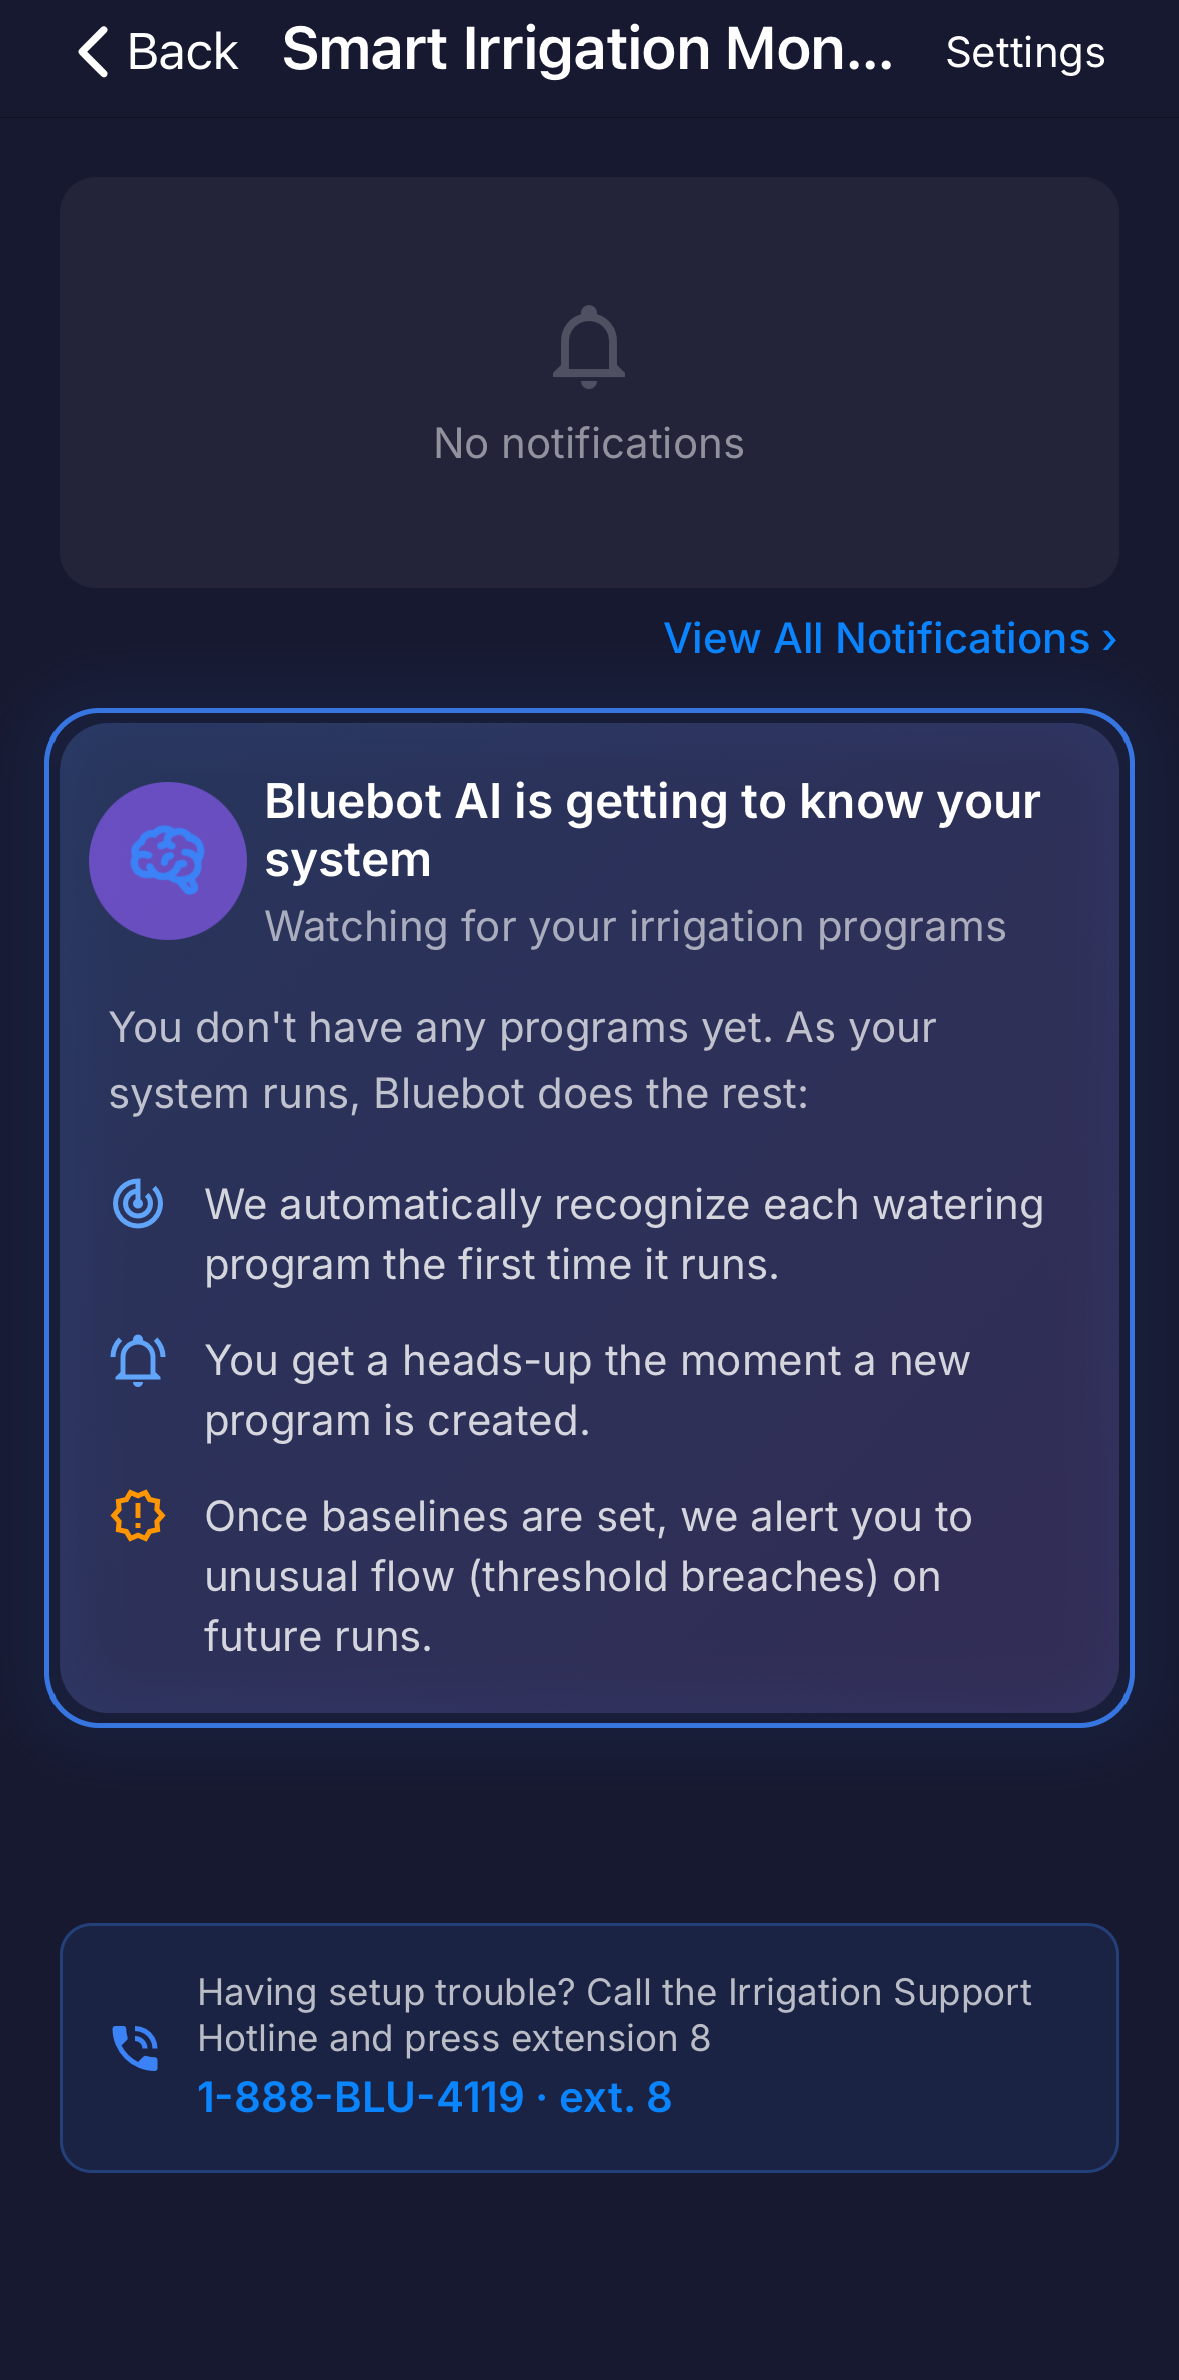 "Bluebot AI is getting to know your system."
Most people should use Quick setup. Manual setup gives you full control and is useful when you want to define programs one at a time, or when an all-stations run is not practical. Instead of detecting your whole system from a single run, Bluebot captures the next complete run of each program (just one) and uses it as that program's healthy baseline.
Start manual setup
On the setup choice screen, open Set up manually instead and continue. The dashboard enters setup mode and shows an "IN SETUP" badge with the heading "Capturing each program's baseline." Bluebot now watches for programs to run.
 Dashboard in setup mode, capturing baselines.
Two ways to capture a baseline
Run a program as usual
Just let a program run on its normal schedule. Bluebot captures it the moment it starts, with nothing to do in the app.
Use a healthy day from history
If irrigation already ran normally on a recent day, tap Check a day in history, pick that day, and Bluebot scans it to build the baseline. This is the fastest option if you do not want to wait for the next scheduled run.
 The "Check a day in history" day picker.
Configure each program and station
After a run is captured, tap Set Up Controller & Program to open the setup wizard. There you:
- Name the program and assign it to a controller.
- Set a default threshold for the program.
- Step through each station to name it and set its average flow and thresholds.
- Split or merge stations if Bluebot grouped them differently from how your controller runs them.
Repeat for each program. When every program has a baseline, finish the same notification setup as the quick path, and the dashboard switches to live monitoring.
 A station step of the manual setup wizard.
The dashboard
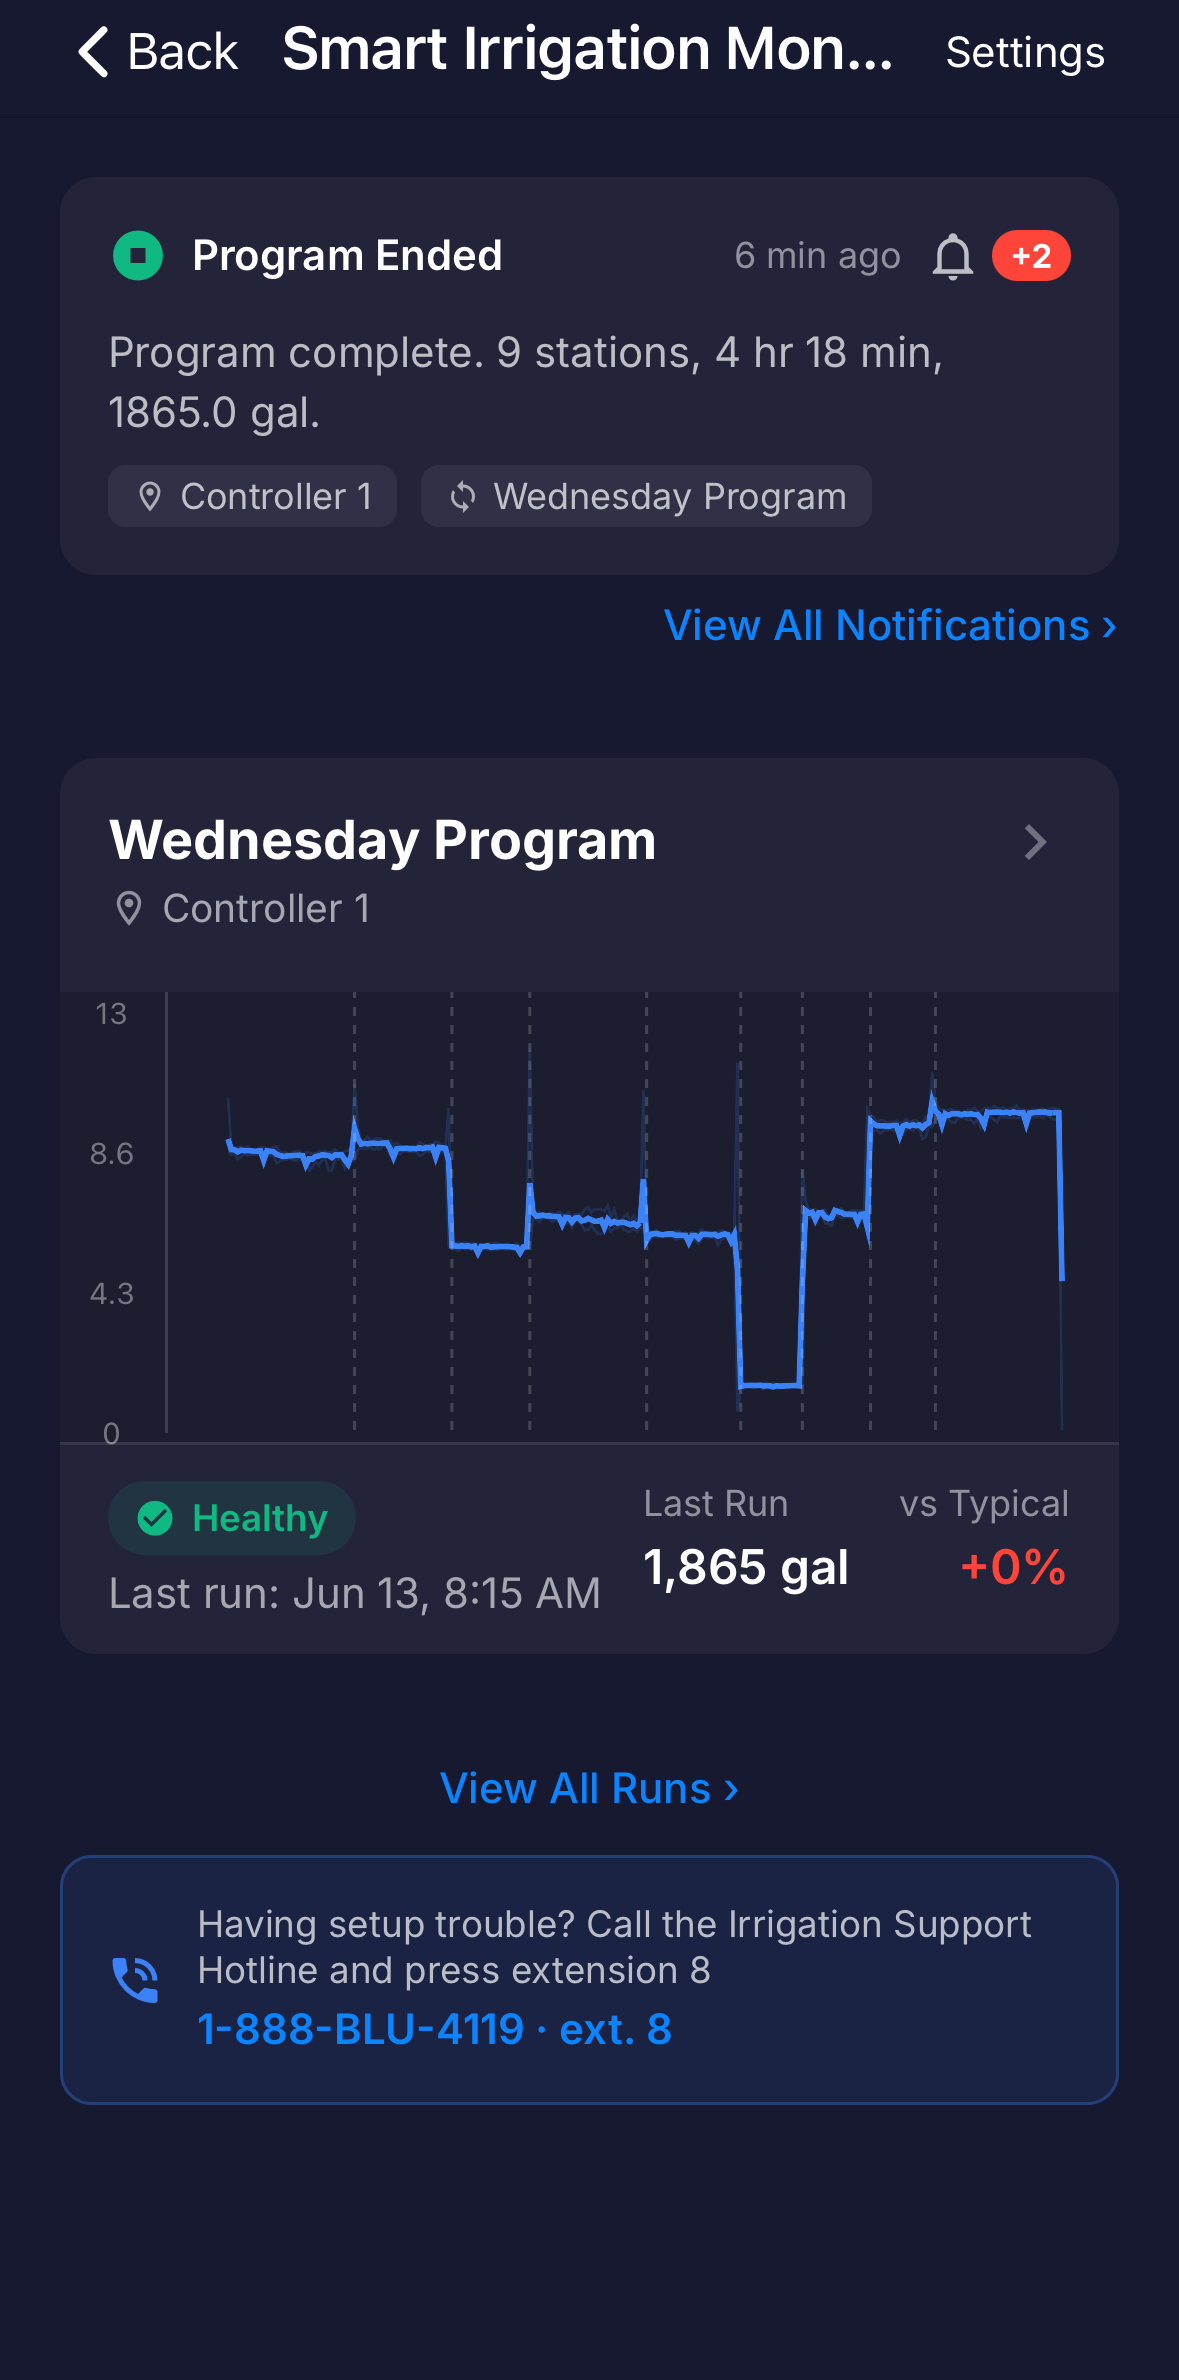
On your device's Irrigation tab, the Smart Irrigation Monitor card shows a quick summary (the most recent program and key totals). Tap View details to open the main dashboard, which shows a card for each program. At a glance you can see whether the last run looked healthy, how much water it used, and how that compares to normal. Each card is a teaser: tap it to open the full program screen.
What a program card shows
- Status badge: Running, New, Healthy, Alert, or Manual, with a short breach summary like "2 stations above · 1 below" when a run had a problem.
- Flow chart: the shape of the most recent run, station by station.
- Last Run: water used by the most recent run.
- vs Typical: whether this run used more or less water than usual.
- Running Now and Elapsed: live water used and time so far while a program is currently running.
The fuller stats (totals, averages, and alert rate) live on the program screen you reach by tapping the card. See Viewing a program.
 The live dashboard with program cards.
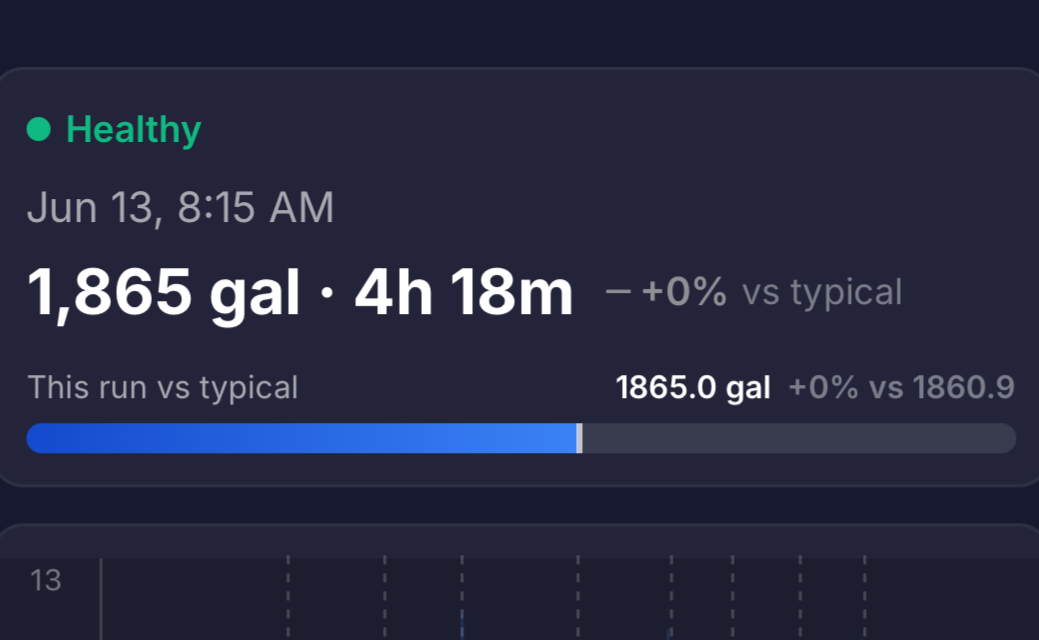
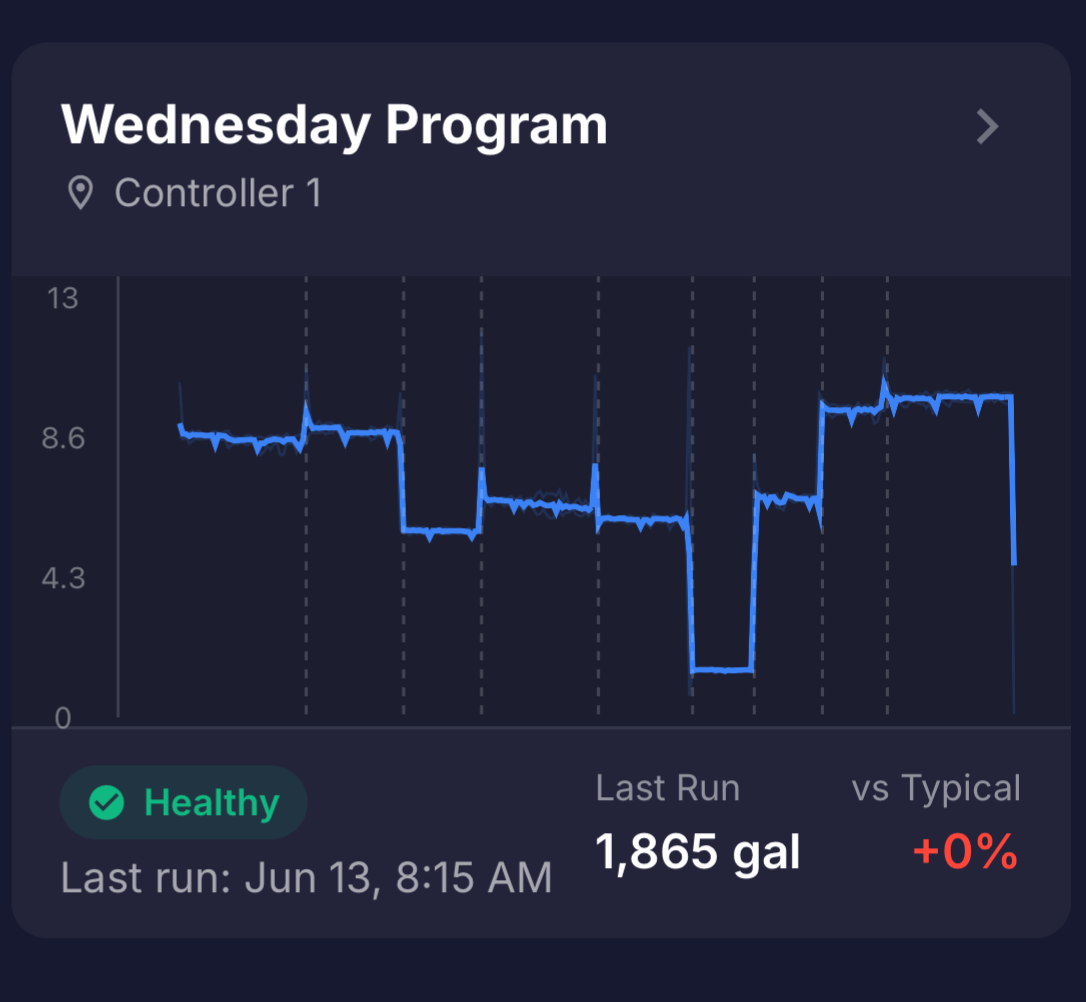 A single program card, marked Healthy.
 A run flagged with an Alert, with the breach summary.
The Manual watering card
Watering that does not match one of your known programs appears here as Manual watering. It is normal to see this when someone waters by hand or runs a one-off cycle. To be told when it happens, turn on Manual Watering Started or Manual Watering Ended in Settings.
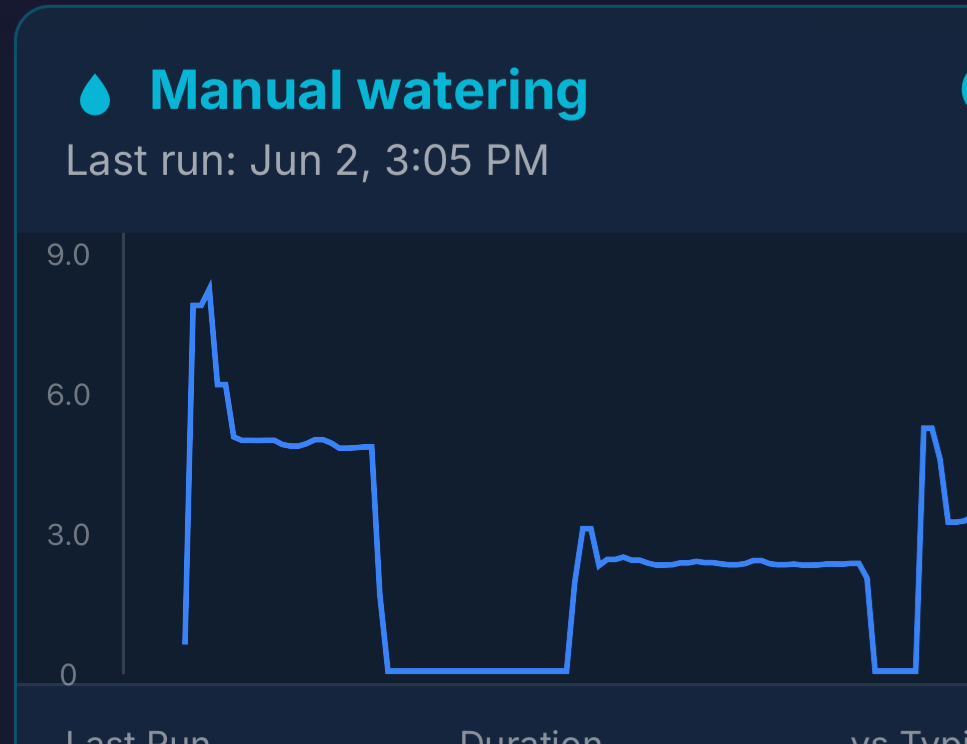 The Manual watering card.
Viewing all runs
Tap View All Runs for the full history. You can filter by day of the week, and tap any run to open its detail and flow chart.
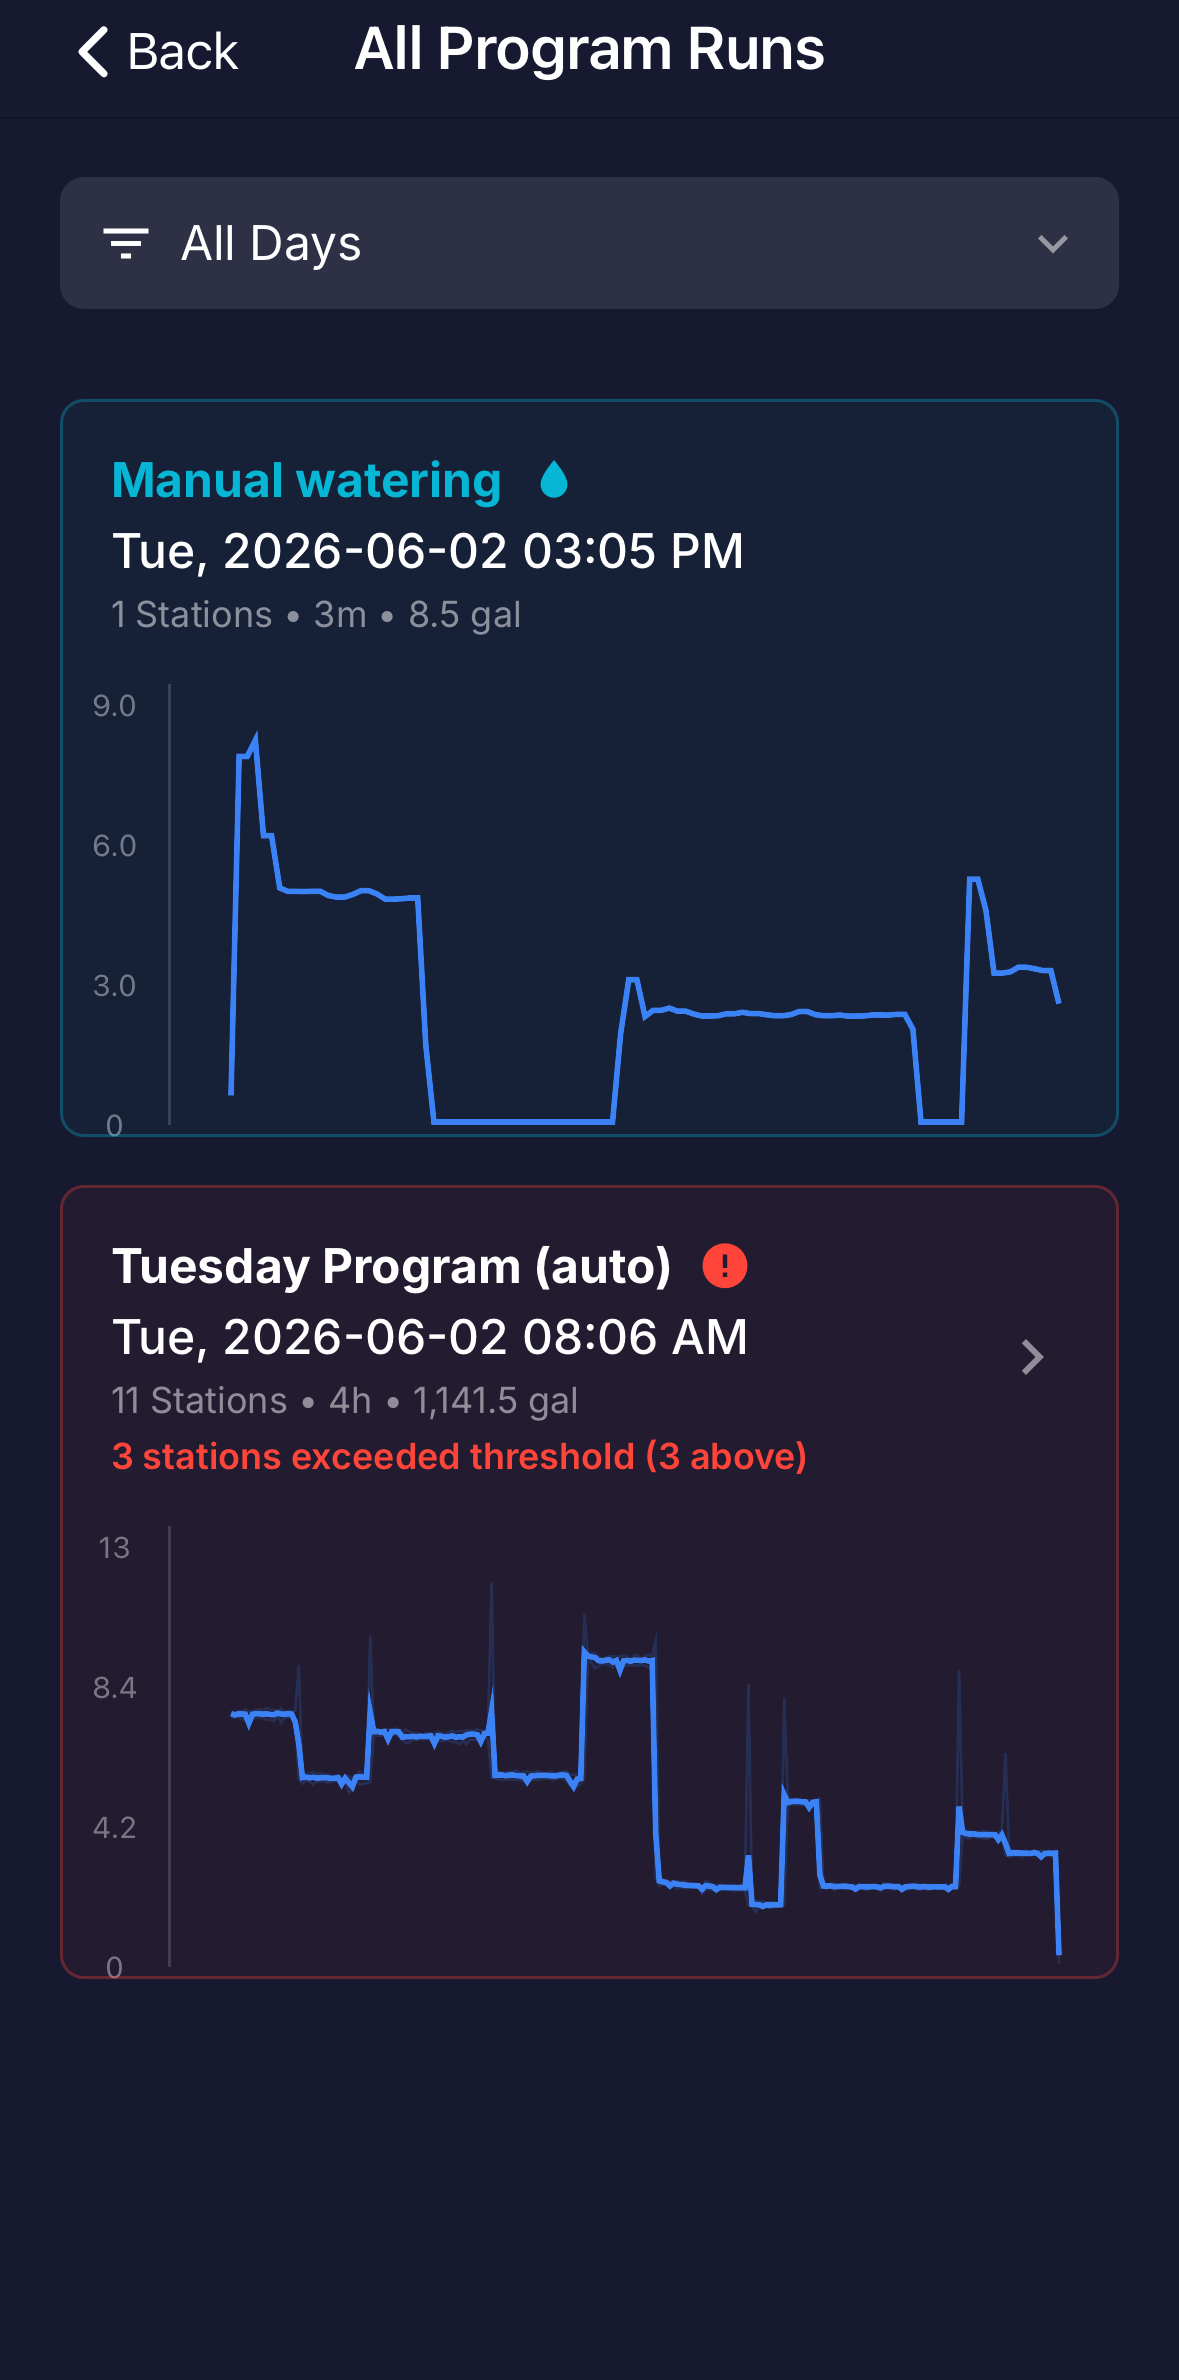 The "All Program Runs" list with the filter open.
Viewing a program
Tap any program card on the dashboard to open its screen. A toggle near the top switches between four tabs: Last Run, Stations, Trends, and History. This is where the full detail for a program lives. (Manual watering has no Stations tab.)
Last Run
A summary of the most recent completed run: its status and any breach summary, the date and time, total water used and how long it took, and how that compares to typical (the This run vs typical bar). Below that is the flow chart and a Stations on this run breakdown. Tap View full run details for the complete run. If a run is happening right now, this tab shows it live as Run in progress.
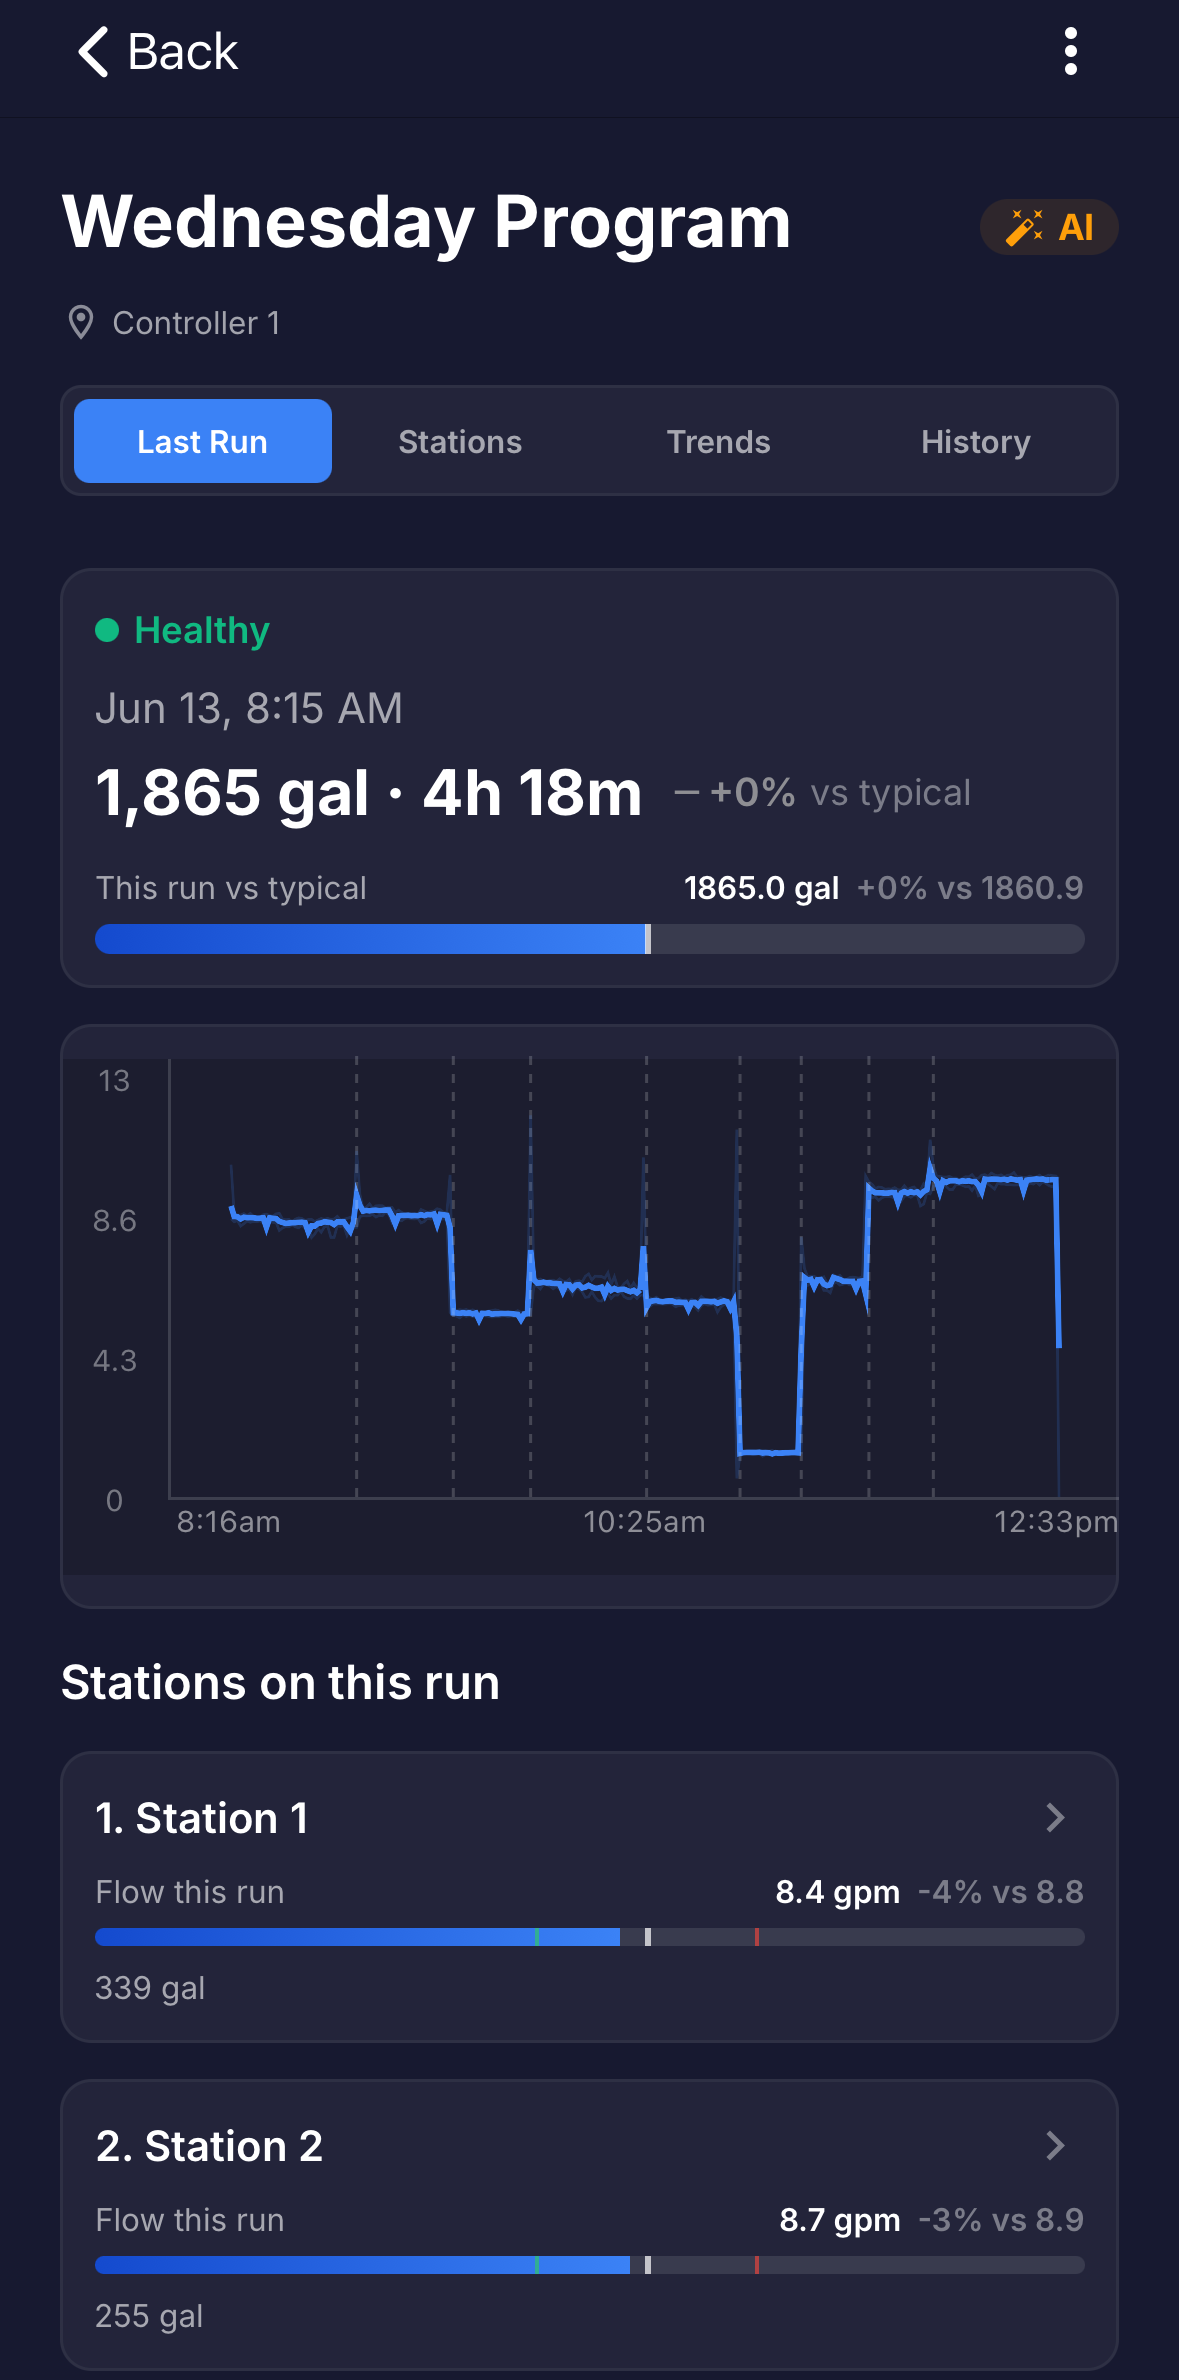 The Last Run tab.
Stations
Every station in this program, in run order. Each one shows its average flow against its baseline (the Avg flow bar), the total water it has used, and its breach rate. If a station also runs in other programs, a line shows its share of runs and water across them. Tap a station to open its own screen. See Viewing a station.
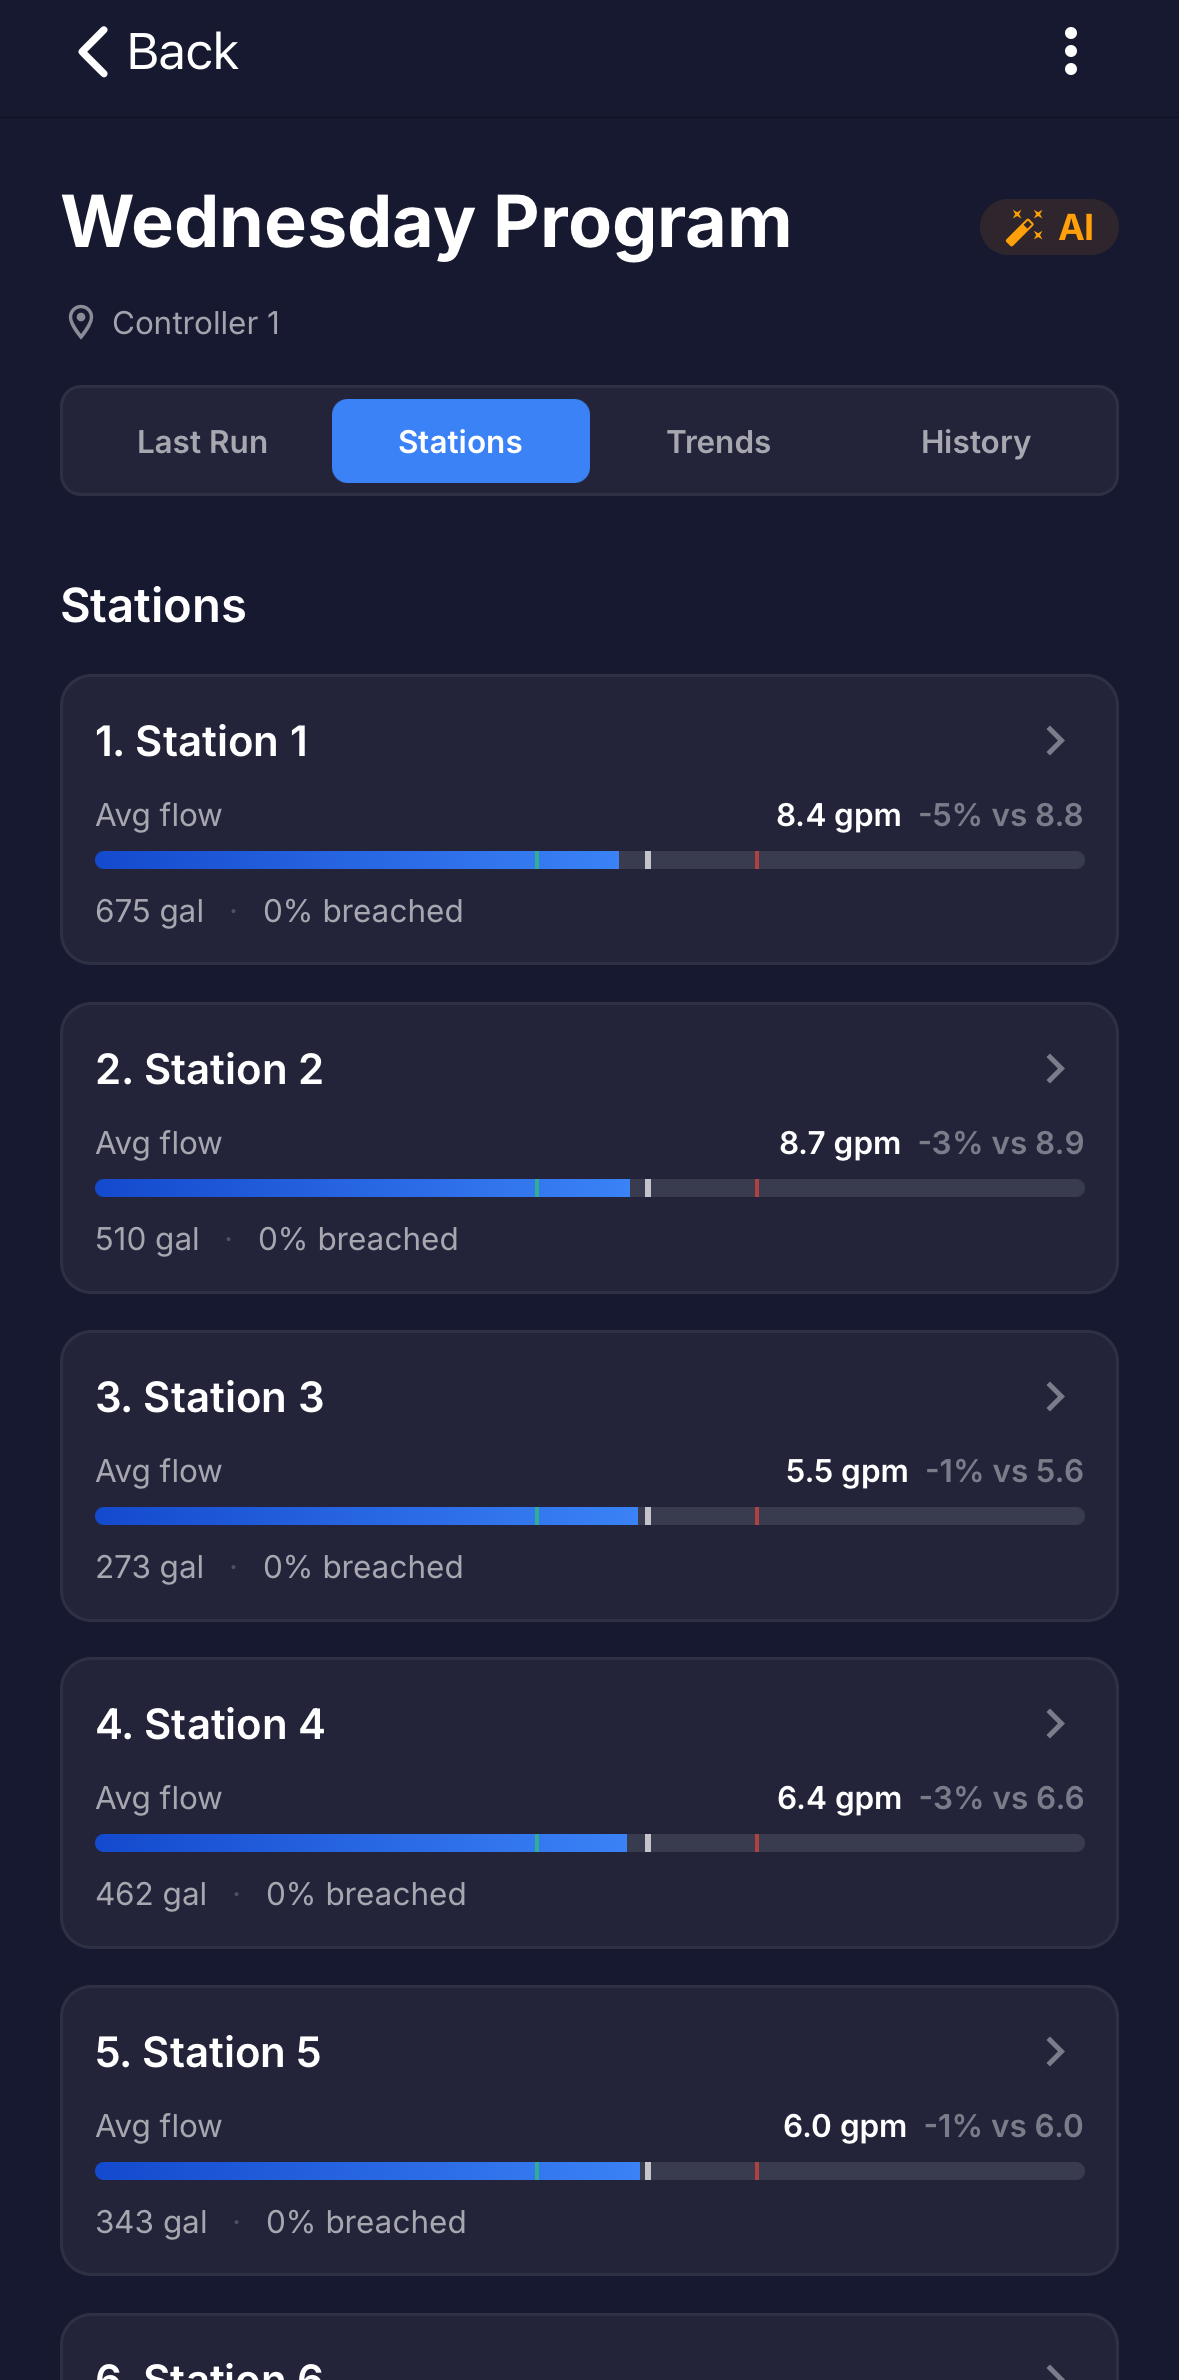 The Stations tab.
Trends
The big-picture numbers for this program: All Runs, Total Water, This Week (with the change vs last week), Avg / Run, Avg Time, and Alert Rate (tap its info icon for an explanation). Below the tiles, a Water used per run chart plots each run against the typical amount; tap a bar to jump to that run.
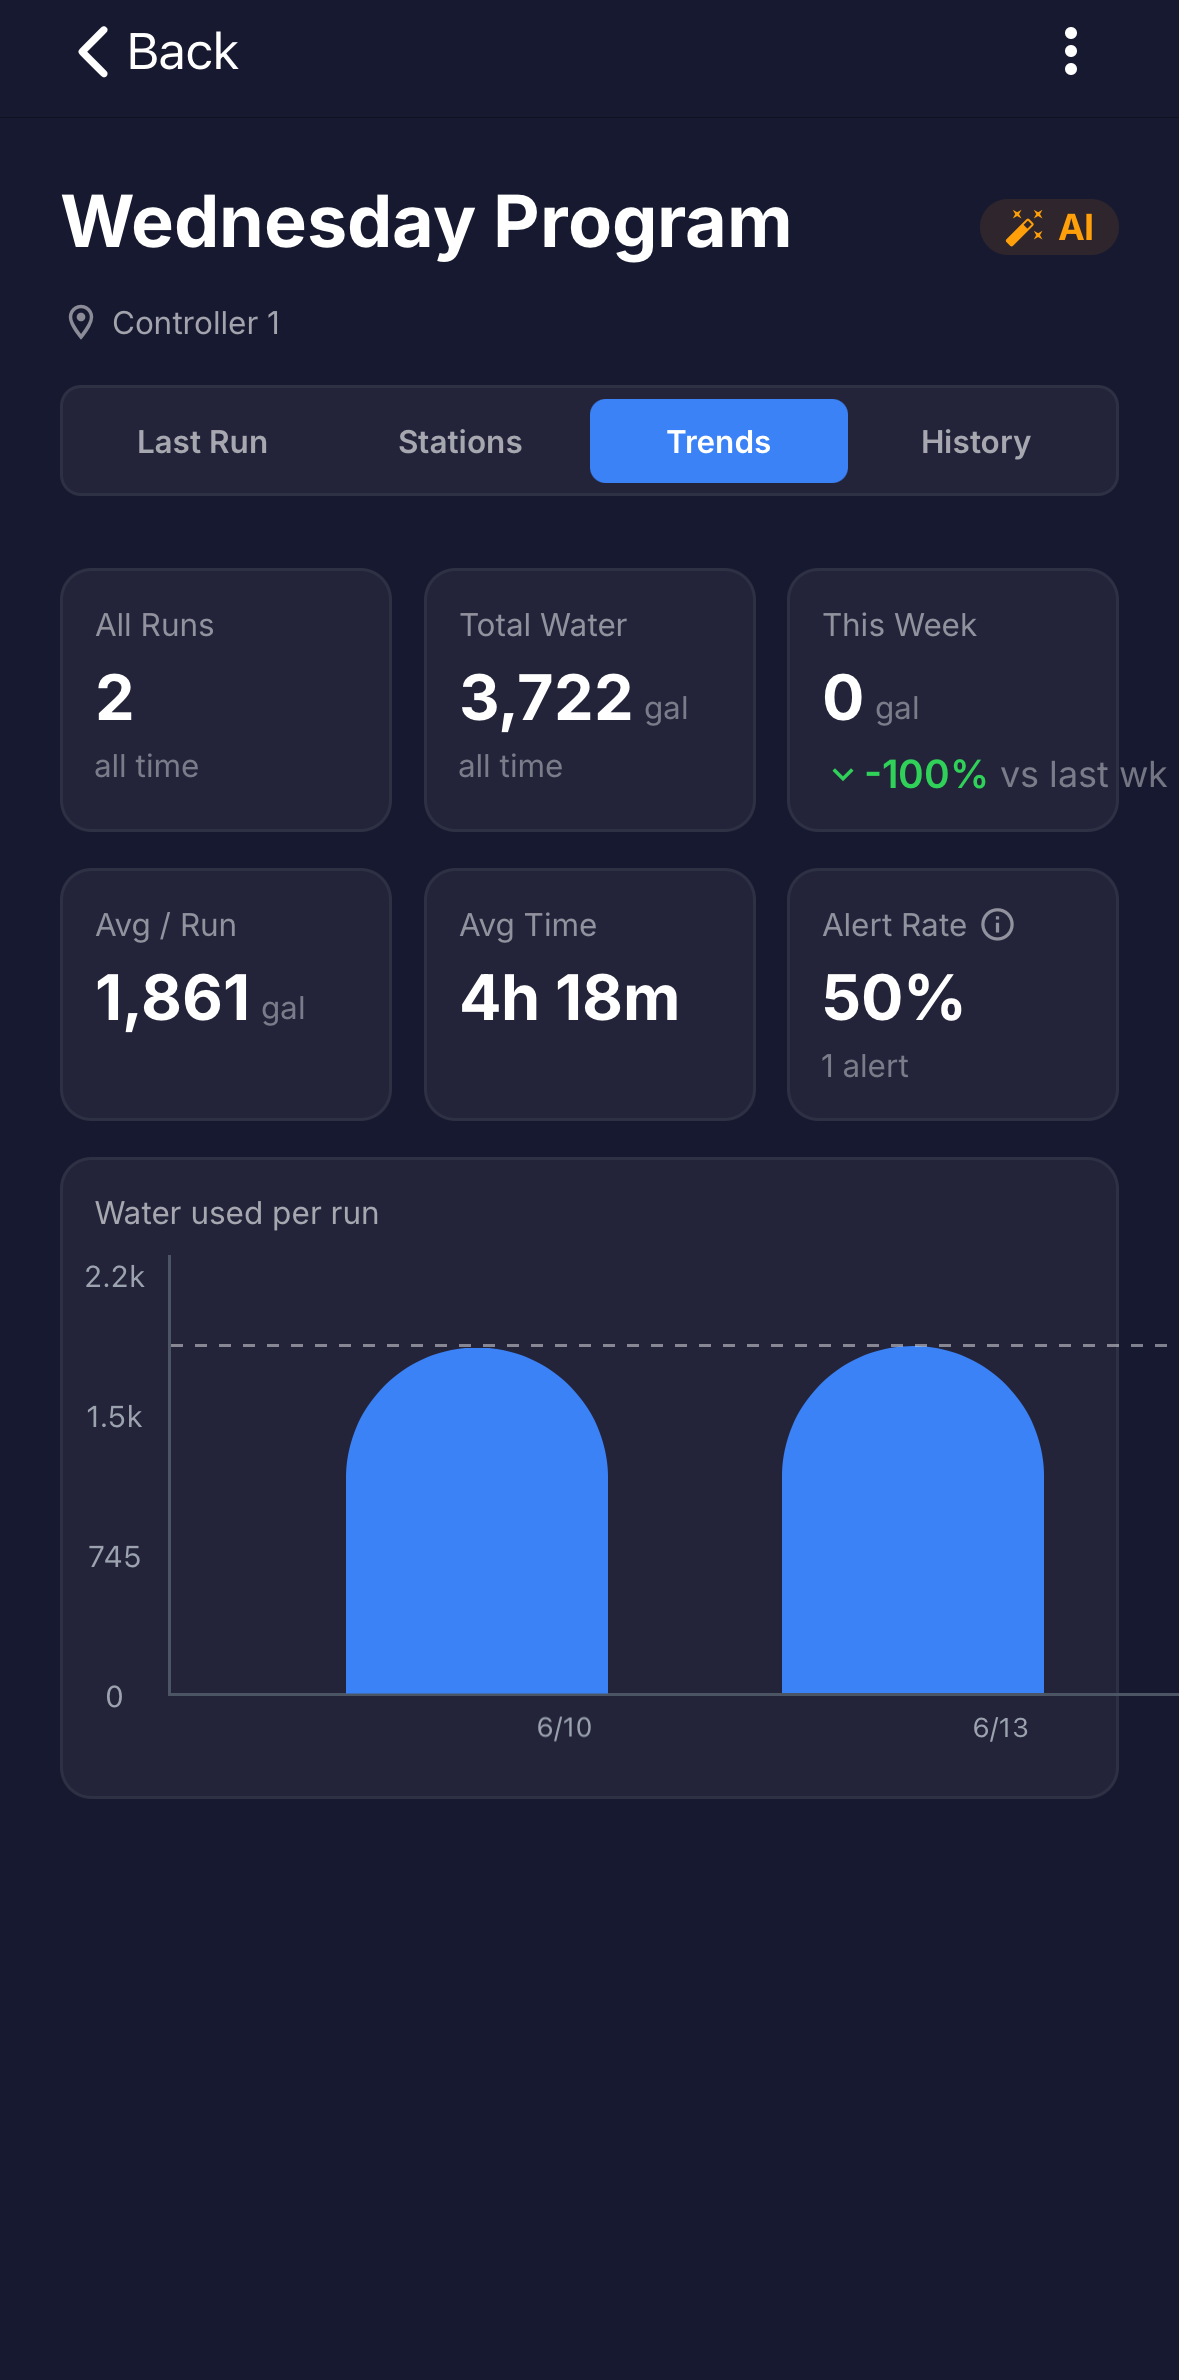 The Trends tab.
History
Every past run of this program, newest first. Each entry shows the date and time, duration, total water, and a flow chart, and flags any alerts or unassigned stations. Tap a run to see its full summary, then tap All runs to go back to the list.
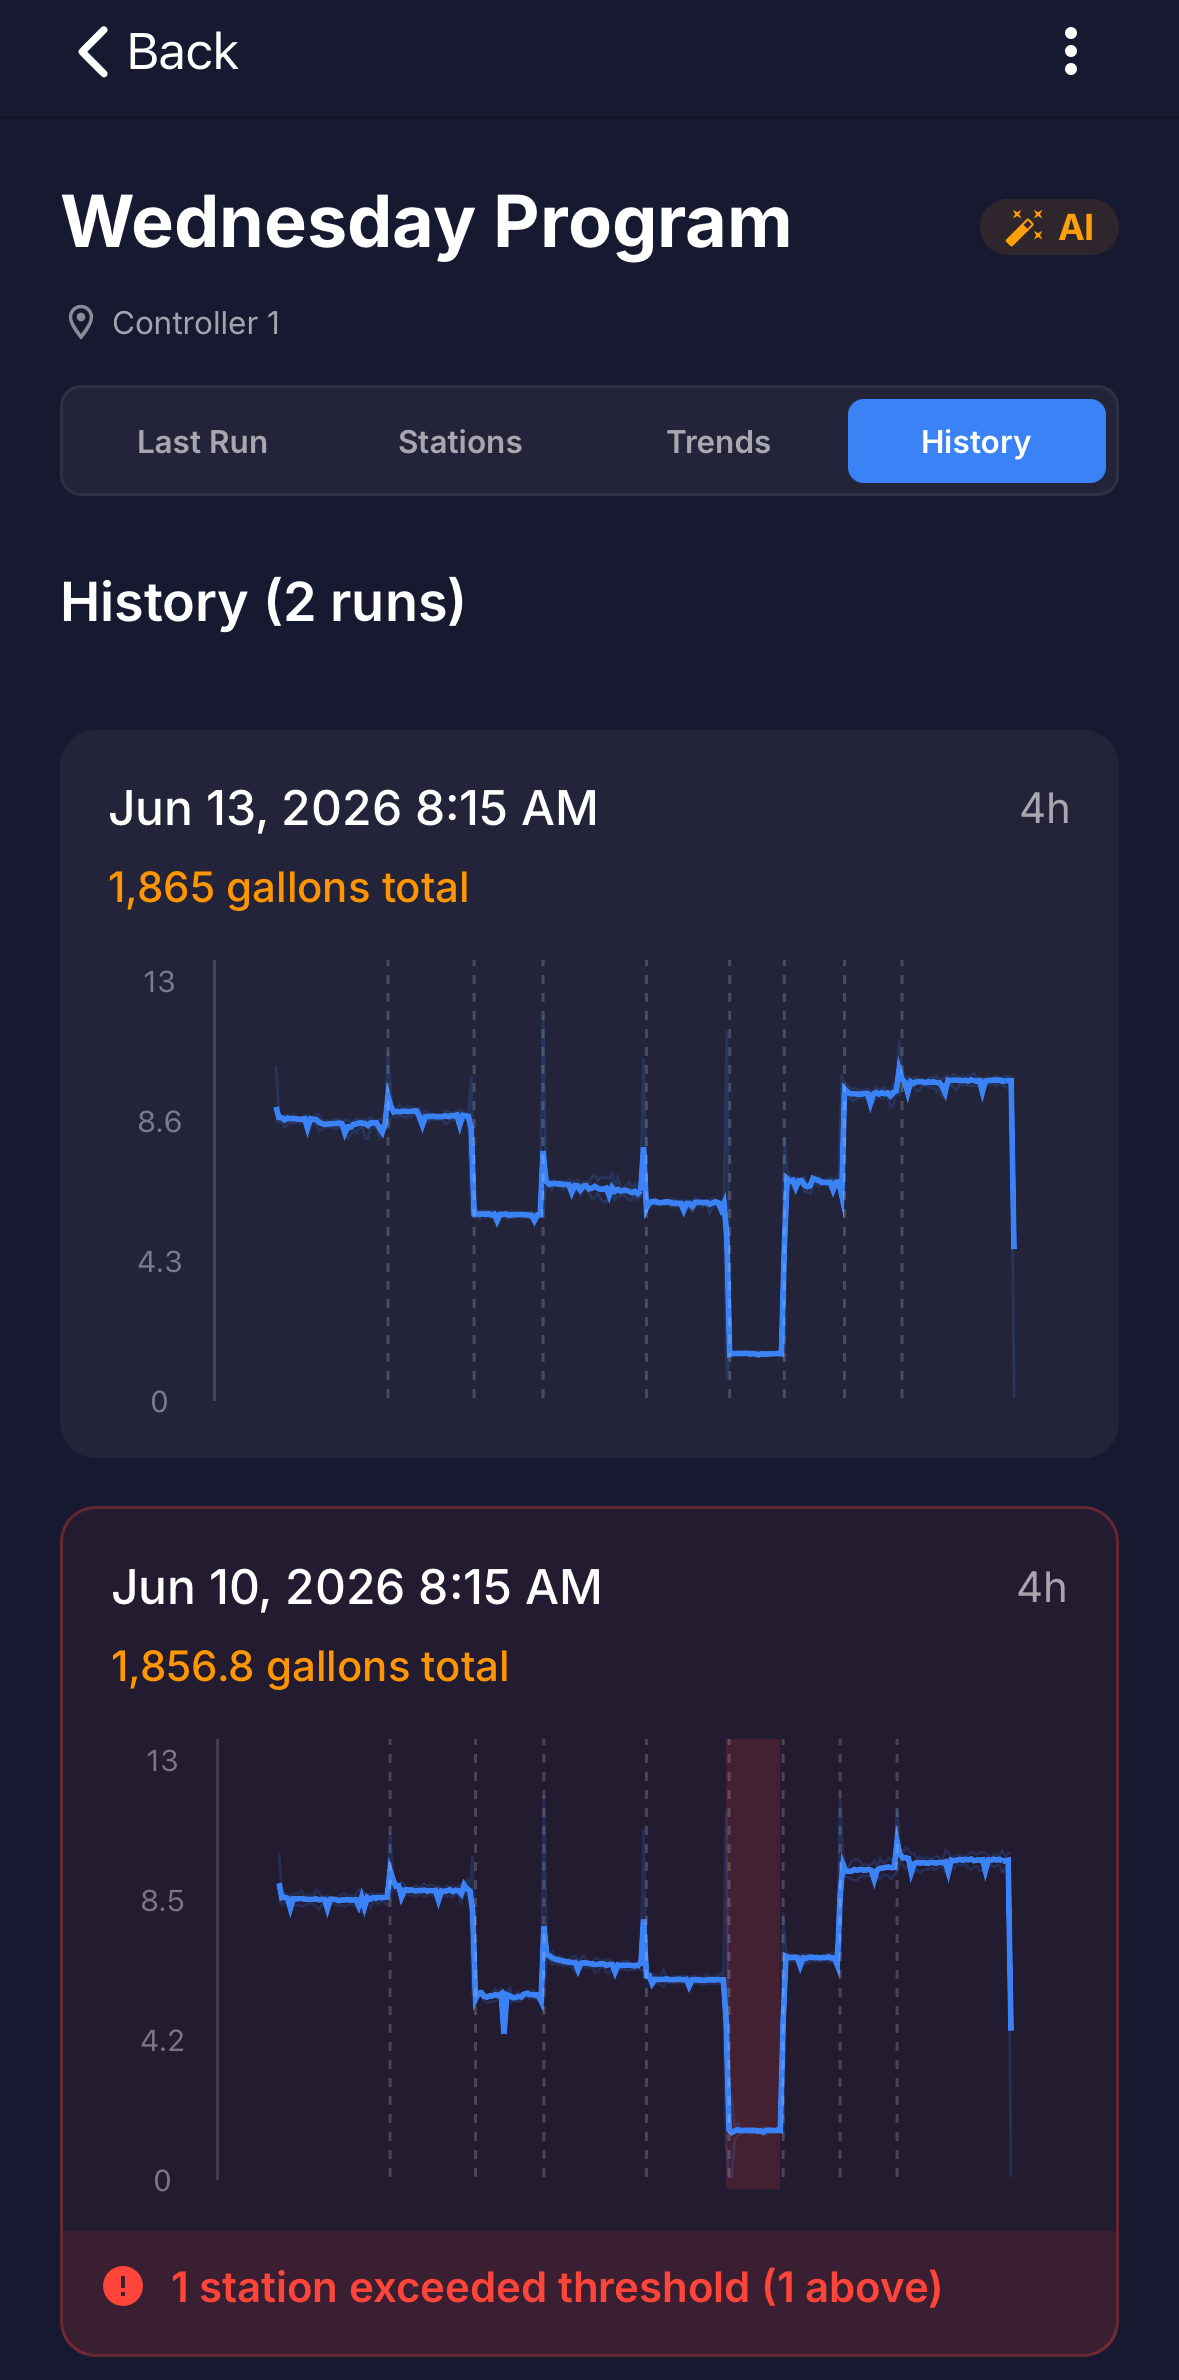 The History tab.
Viewing a station
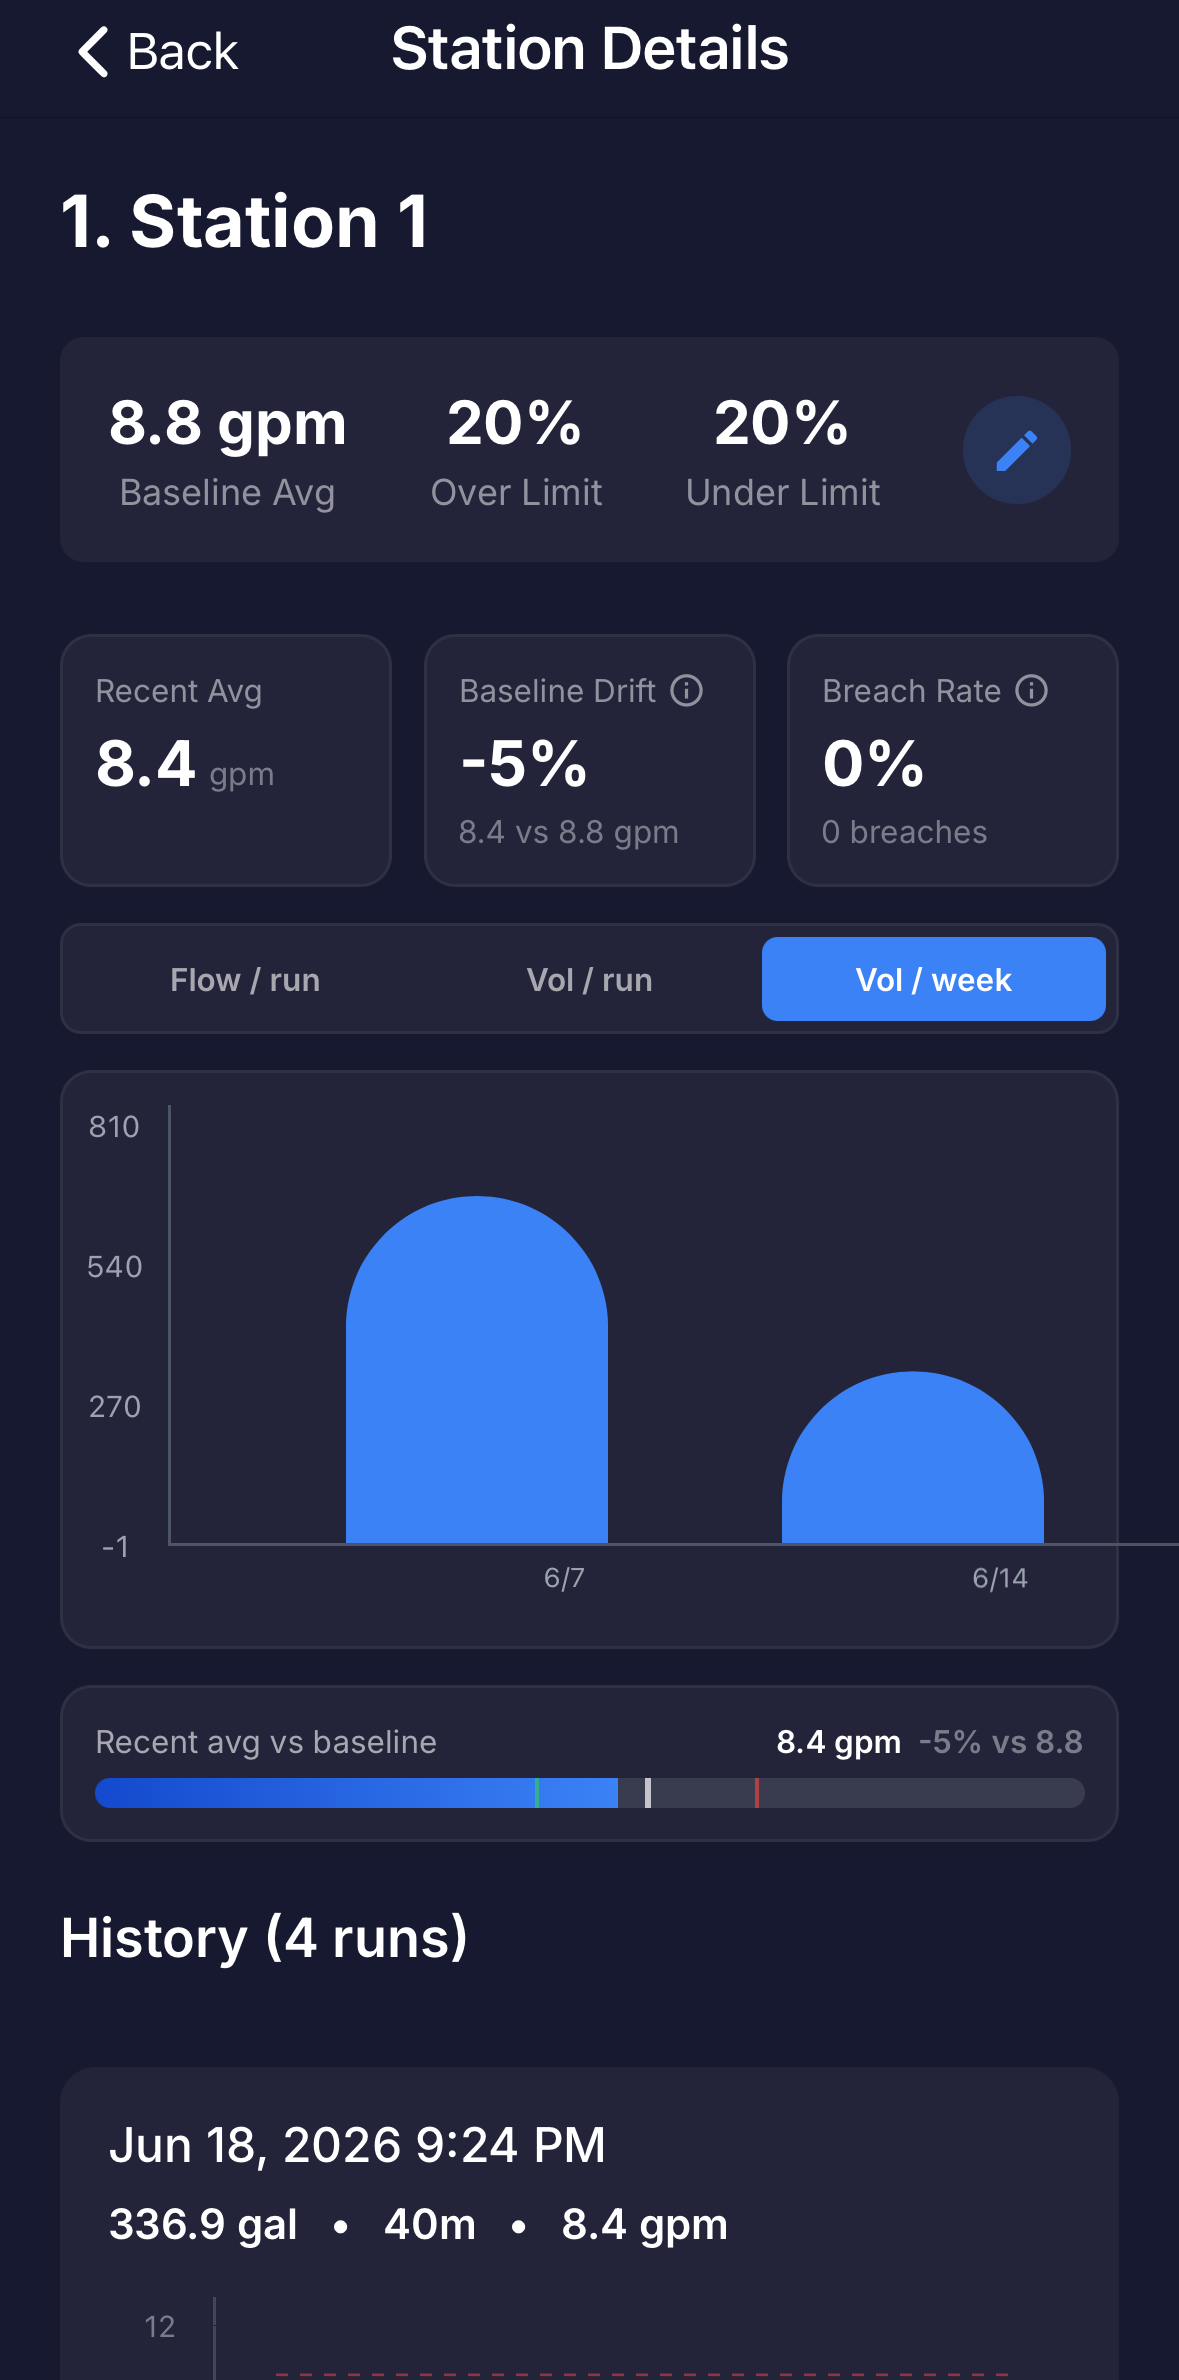
Tap a station on a program's Stations tab to open its own screen (titled Station Details). This is the deepest view, focused on a single station (zone): its baseline, its limits, how its flow is trending, and its full run history.
At the top
- Name and position (and controller, if you have more than one). Tap the name to edit it.
- Baseline Avg, Over Limit, and Under Limit: the station's normal flow and its upper and lower thresholds. The pencil opens Edit Baseline & Limits.
- Recent Avg, Baseline Drift, and Breach Rate: how recent runs compare to the baseline and how often they breached. Each has an info icon that explains it.
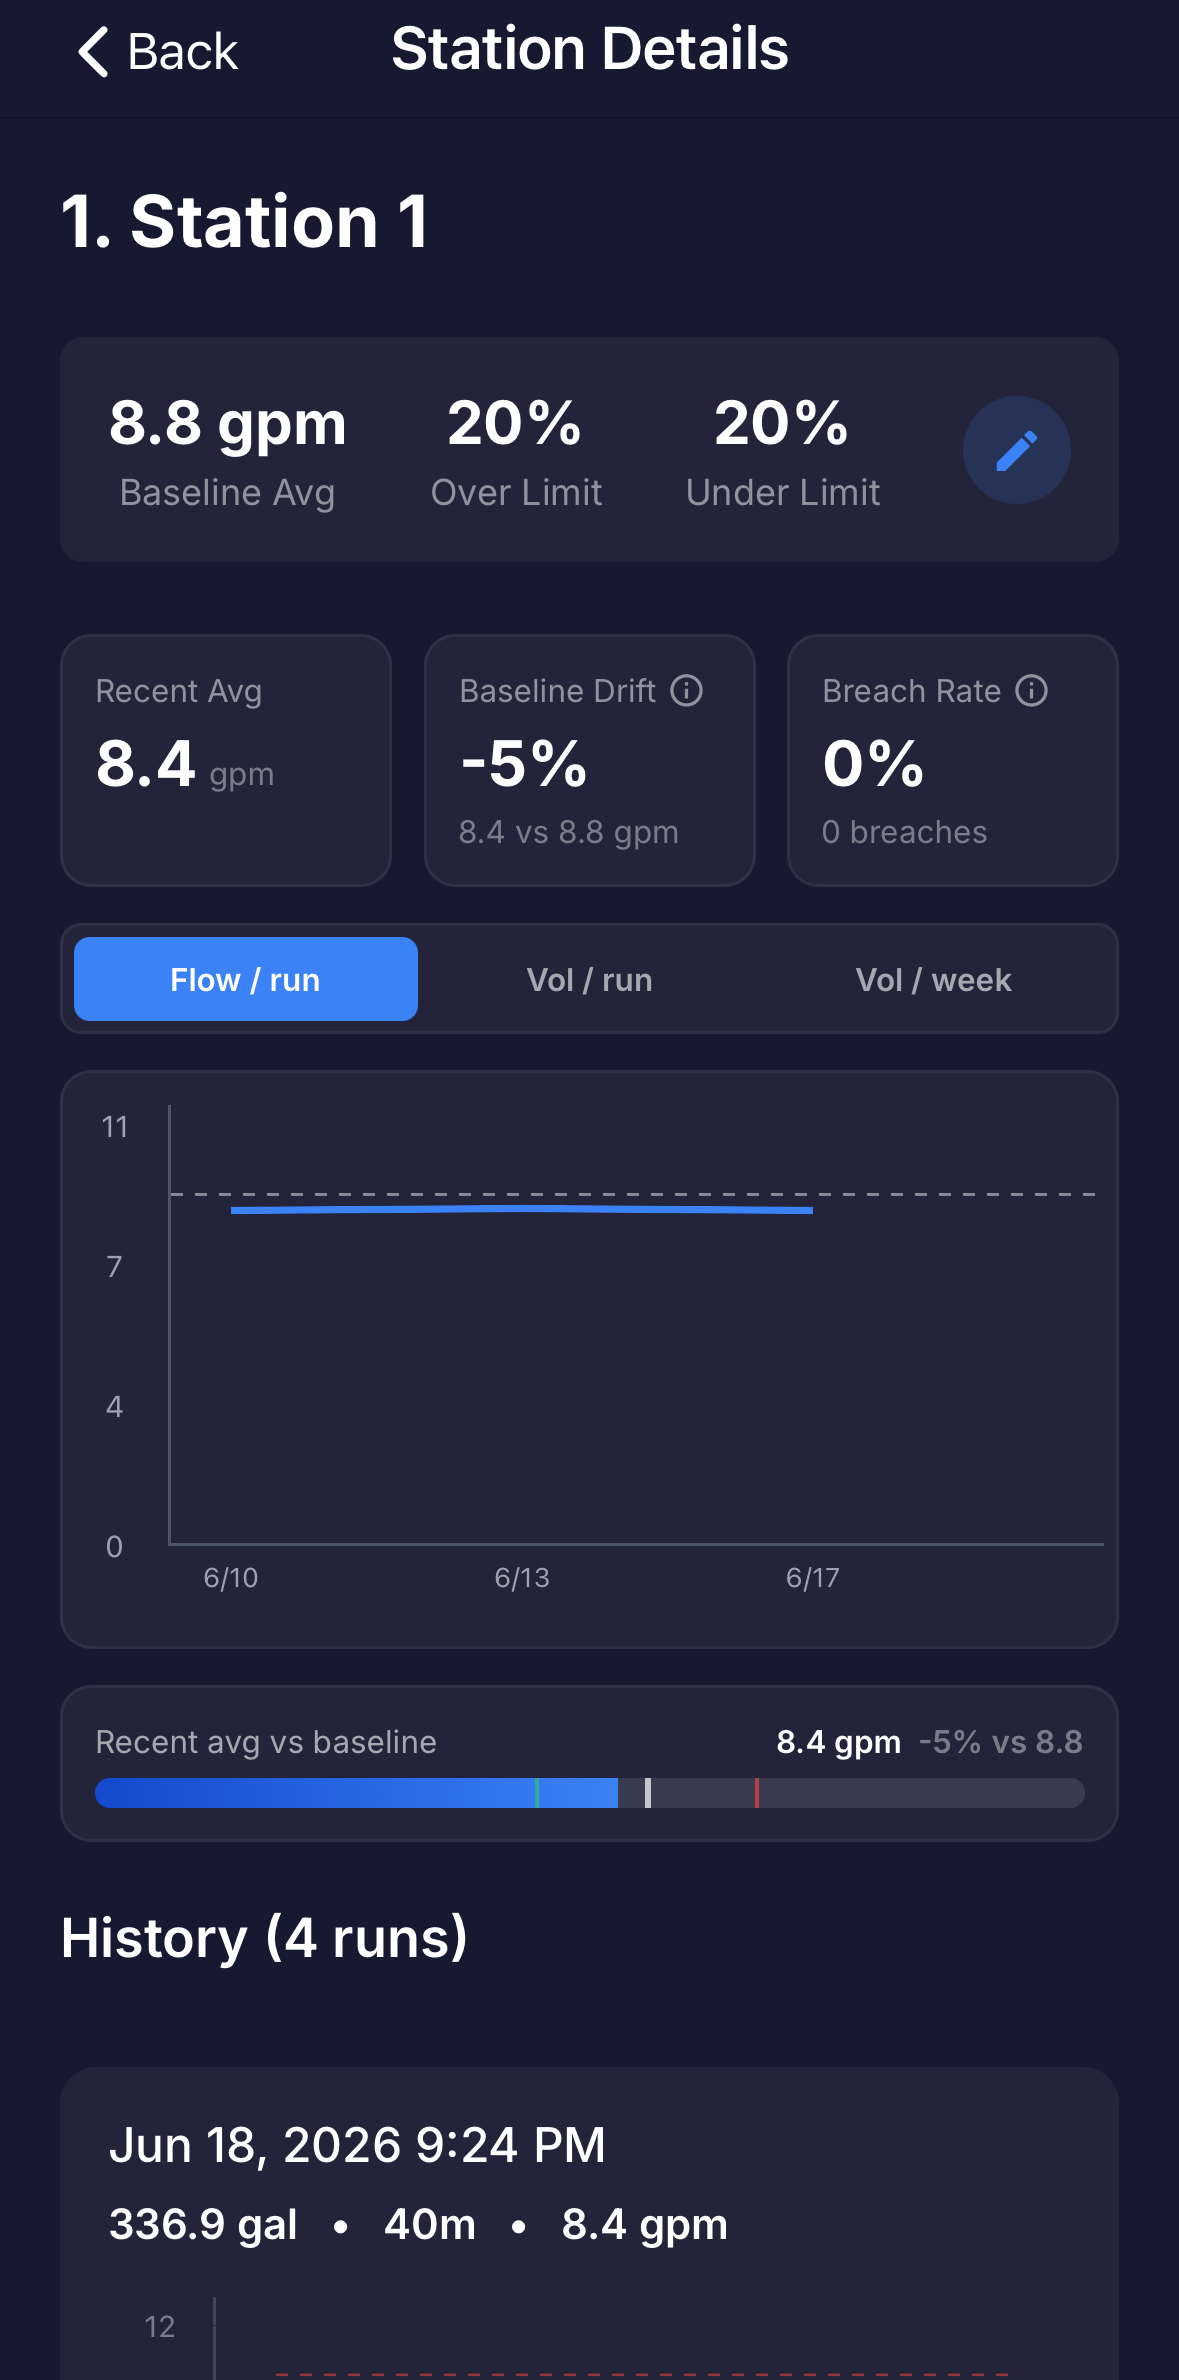 The Station Details screen.
Trends and history
A chart with three views, Flow / run, Vol / run, and Vol / week, shows how the station behaves over time, with the baseline and limits marked. Below it, Recent avg vs baseline sums up where the station sits now, and a History list shows every run with its gallons, duration, flow rate, and a flow chart, noting whether each ran above or below baseline.
 The station's run history.
Adjusting a station
In Edit Baseline & Limits you set the Baseline Average (GPM), with quick Avg. and Recent buttons to fill it from the last few runs, and the Over Limit and Under Limit as percentages of that baseline. Tapping the station name opens Edit Station Info for its name and position. If a station's flow changed for a known reason, like new heads, update its baseline here so future comparisons stay accurate.
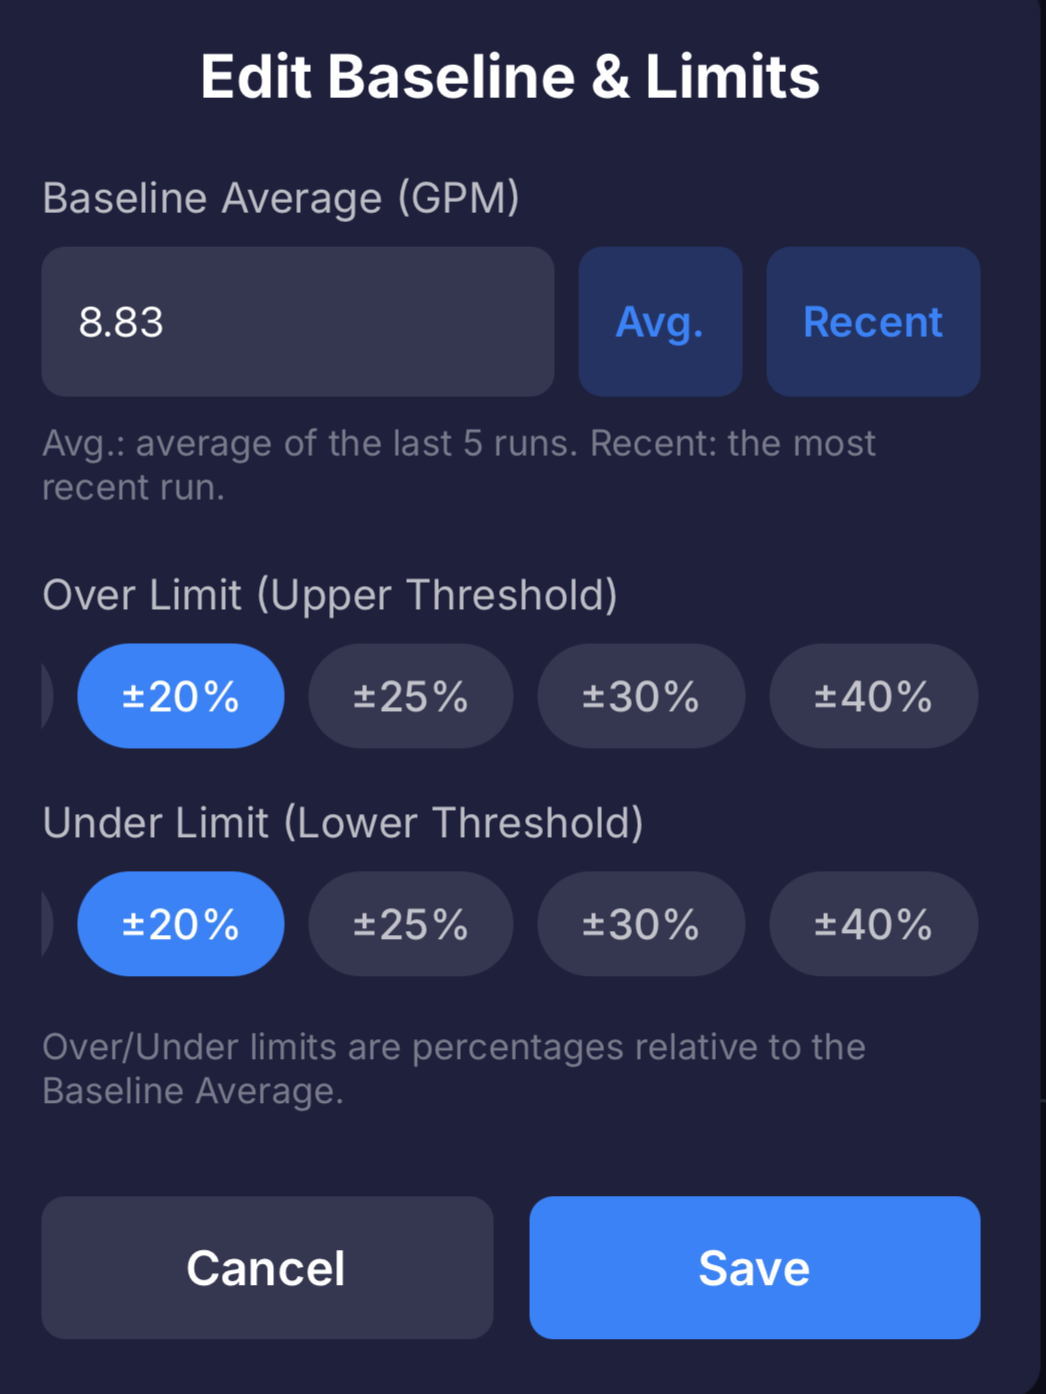 The "Edit Baseline & Limits" editor.
The flow chart appears on each run and plots water flow (gpm) over the course of that run. It is the clearest way to see exactly where a problem happened.
- Blue line: the actual flow during the run.
- Dashed vertical lines: where one station ends and the next begins.
- Baseline line: the normal flow Bluebot learned for the highlighted station.
- Dashed threshold lines: the upper and lower limits (baseline plus or minus the threshold).
- Red shading: flow ran over the upper threshold, often a leak or stuck valve.
- Amber shading: flow ran under the lower threshold, often a clog or broken head.
Tap a station segment to highlight it; the baseline and threshold lines update to that station, and any breach is shaded.
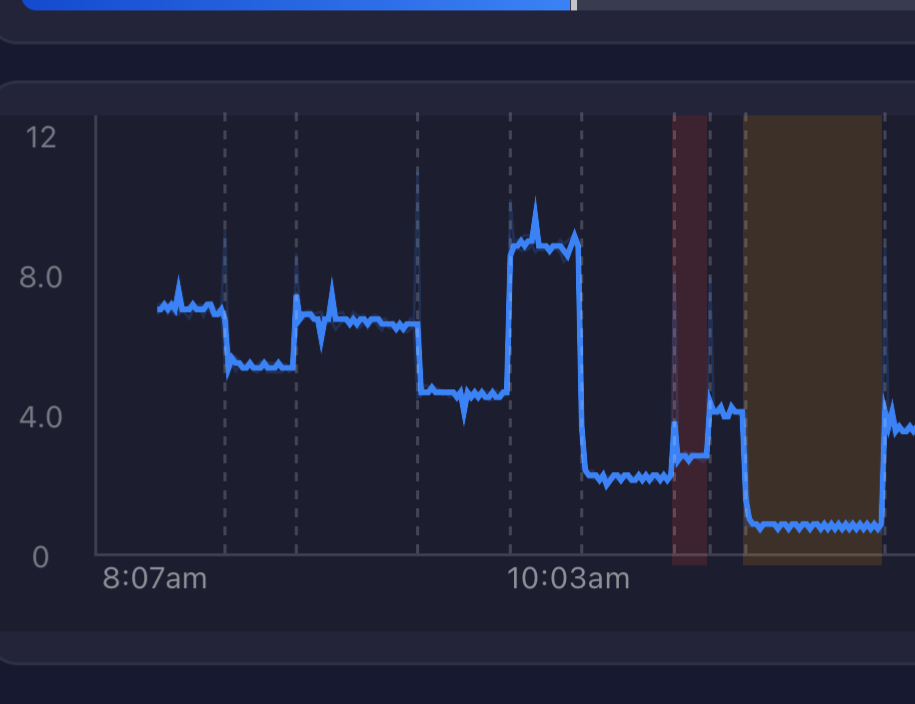 A flow chart with a highlighted station and a breach shaded in red.
Notifications
Bluebot texts the people you choose as your irrigation runs. Each notification below is an independent on/off toggle, so you turn on only the ones you want.
| Notification | What it means |
|---|---|
| Program Start | A recognized program began watering. |
| Program End | A program completed. Healthy runs are a quick recap; problem runs are flagged. |
| Manual Watering Started | Watering began that did not match a known program. |
| Manual Watering Ended | A recap when manual watering finishes. |
| New Program Detected | Bluebot AI recognized and created a new program. |
| Threshold Breach | One or more stations ran above or below their thresholds. |
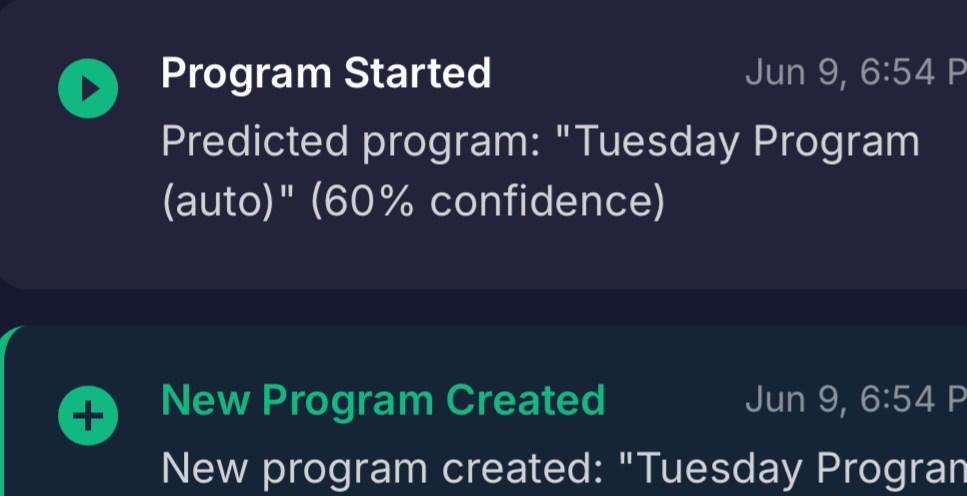 An example text notification.
Turning notifications on and off
Each notification is a simple on/off toggle, and they all start on. In setup and in Settings they are grouped into Routine program updates (Program Start and Program End, the alerts for normal scheduled watering) and When something looks off (Manual Watering Started and Ended, New Program Detected, and Threshold Breach, the alerts that catch problems). Turn off any you do not want, and leave the rest on.
Settings reference
Open Settings from the top of the Smart Irrigation Monitor screen. Everything from setup can be changed here later.
| Setting | What it does |
|---|---|
| Program and station names | Rename programs and stations to match your yard. |
| Thresholds | Adjust the upper and lower limits per station. Widen them if a zone naturally varies a lot. |
| Station Edge Trim | Ignores the brief flow "kick" when one station hands off to the next. Leave on "Smart," or set a fixed number of seconds. |
| Ongoing Program Alert | Texts you if a single program runs longer than a duration you choose. |
| Bluebot AI | When on, recognizes and creates new programs automatically as they run. |
| Notification toggles | Turn each alert on or off: Program Start, Program End, Manual Watering Started, Manual Watering Ended, New Program Detected, and Threshold Breach. |
| Notify accounts | Choose who gets texted. |
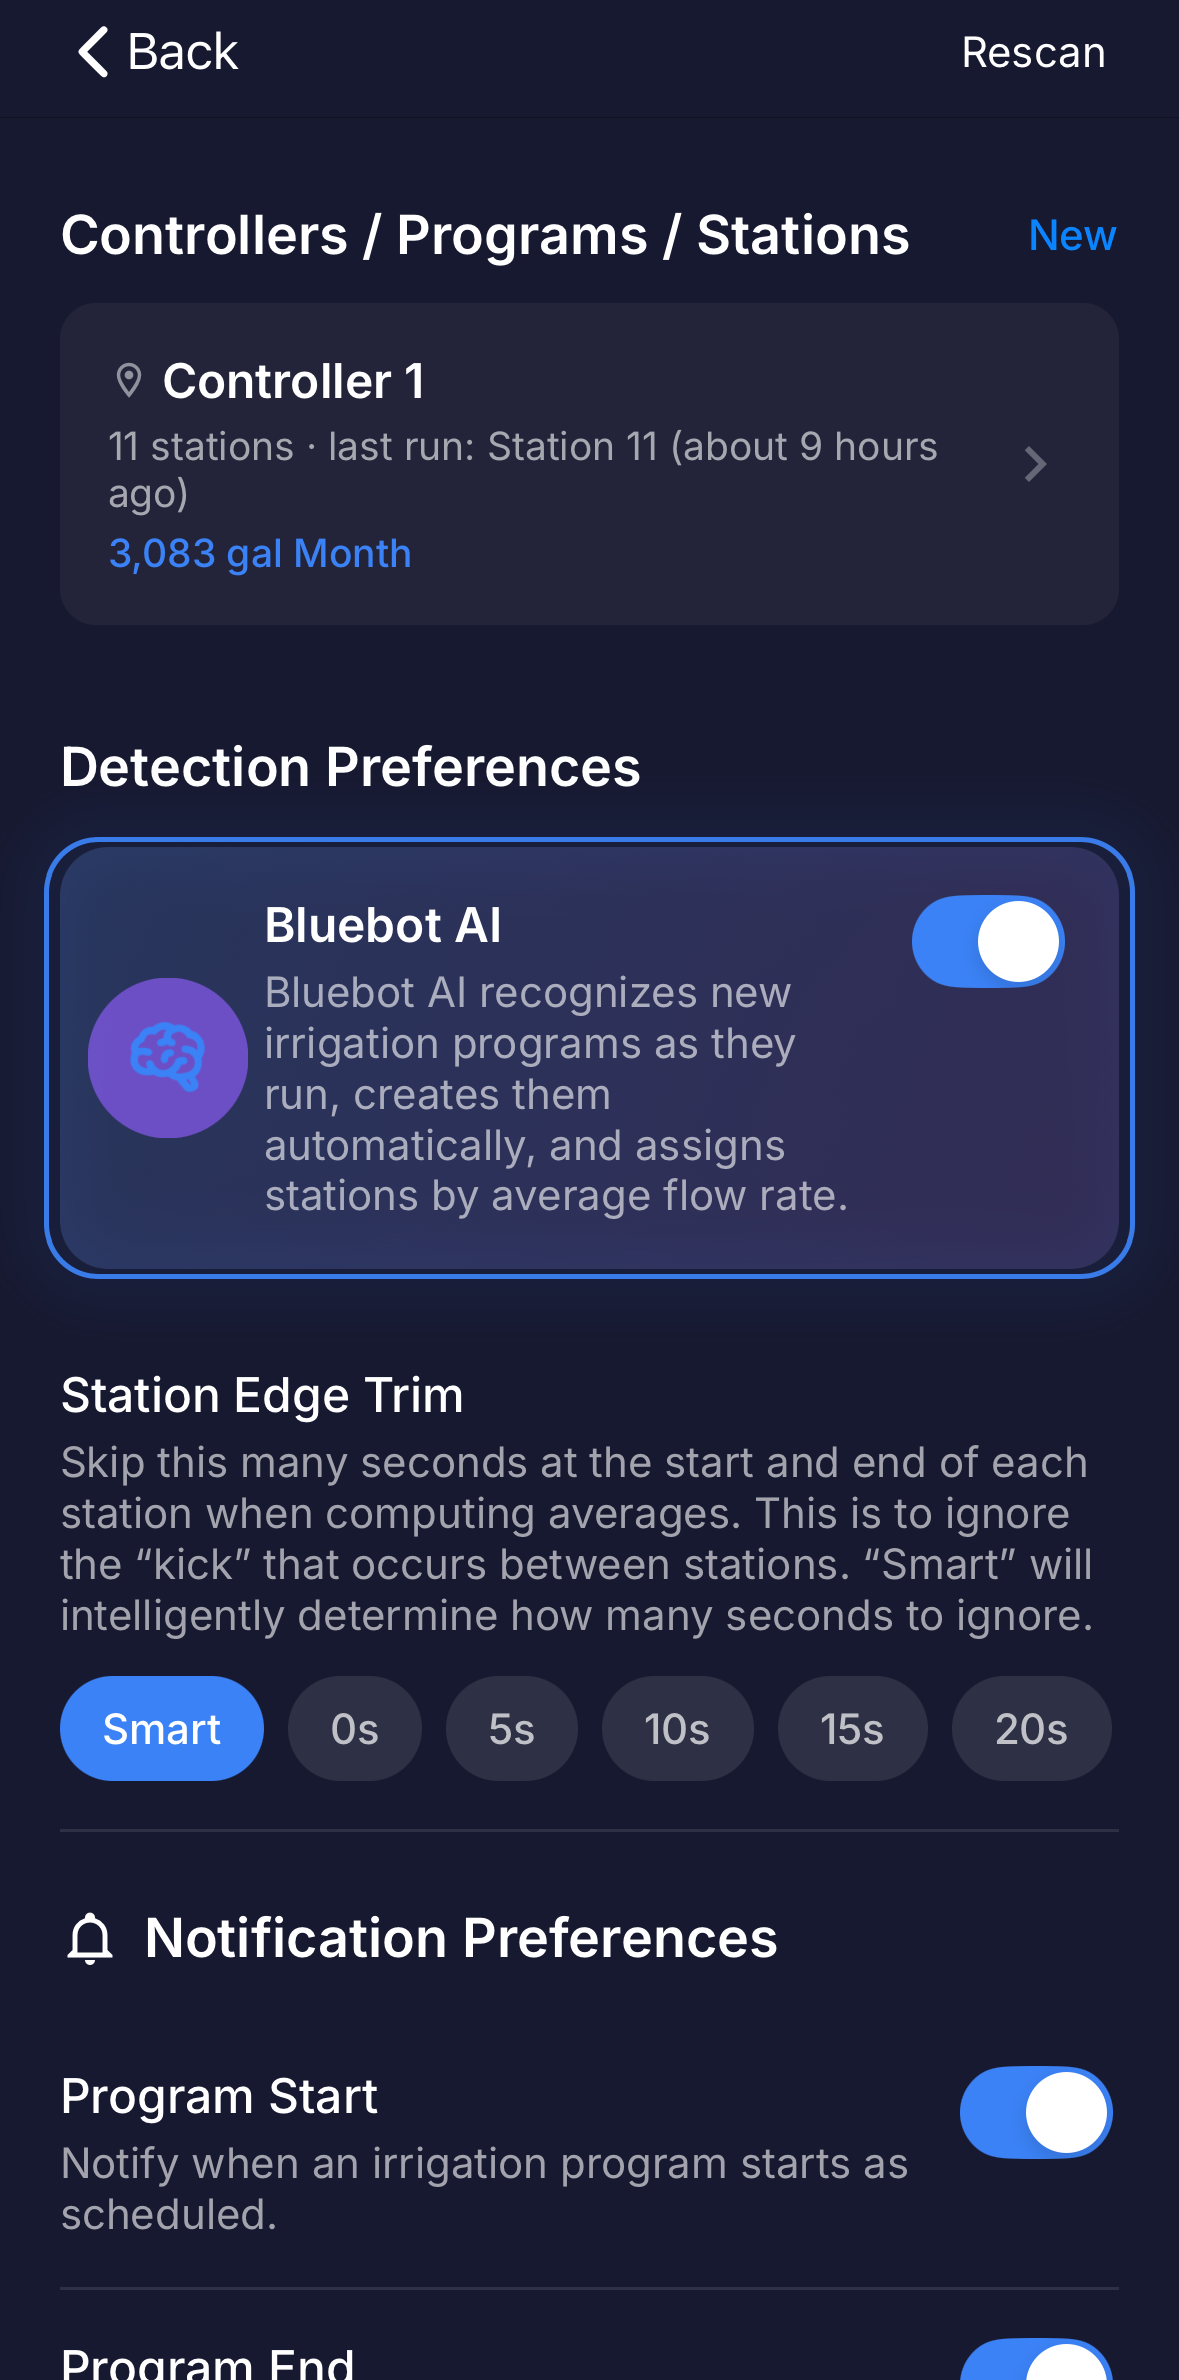 The Settings screen.
This section is about the trends and summaries Bluebot shows inside the app. It is not how breach detection works. A Station's breach detection is configured per Station (its upper and lower thresholds) and is evaluated on Bluebot's servers each time a Program runs: if a Station's flow falls outside its thresholds, that run is flagged and can trigger a notification.
The views below do not change what counts as a breach. They summarize a rolling window of recent history (about 90 days) so the flagged runs are easier to interpret. You see them on the program screen (the Trends tab, including Alert Rate) and the station screen (Baseline Drift and Breach Rate).
| Trend shown | What it can indicate |
|---|---|
| Baseline drift | A station's recent average flow has moved away from its trained baseline. Drifting up often means a slow leak; drifting down often means a developing clog. |
| Breach rate | How often a station's runs land outside its thresholds. A zone that breaches in most recent runs is escalated. |
| Week over week | A sizable jump in water used compared with the same period last week can signal a new leak. |
| Latest vs typical | A single run that used far more water than the program's usual amount is flagged on its own. |
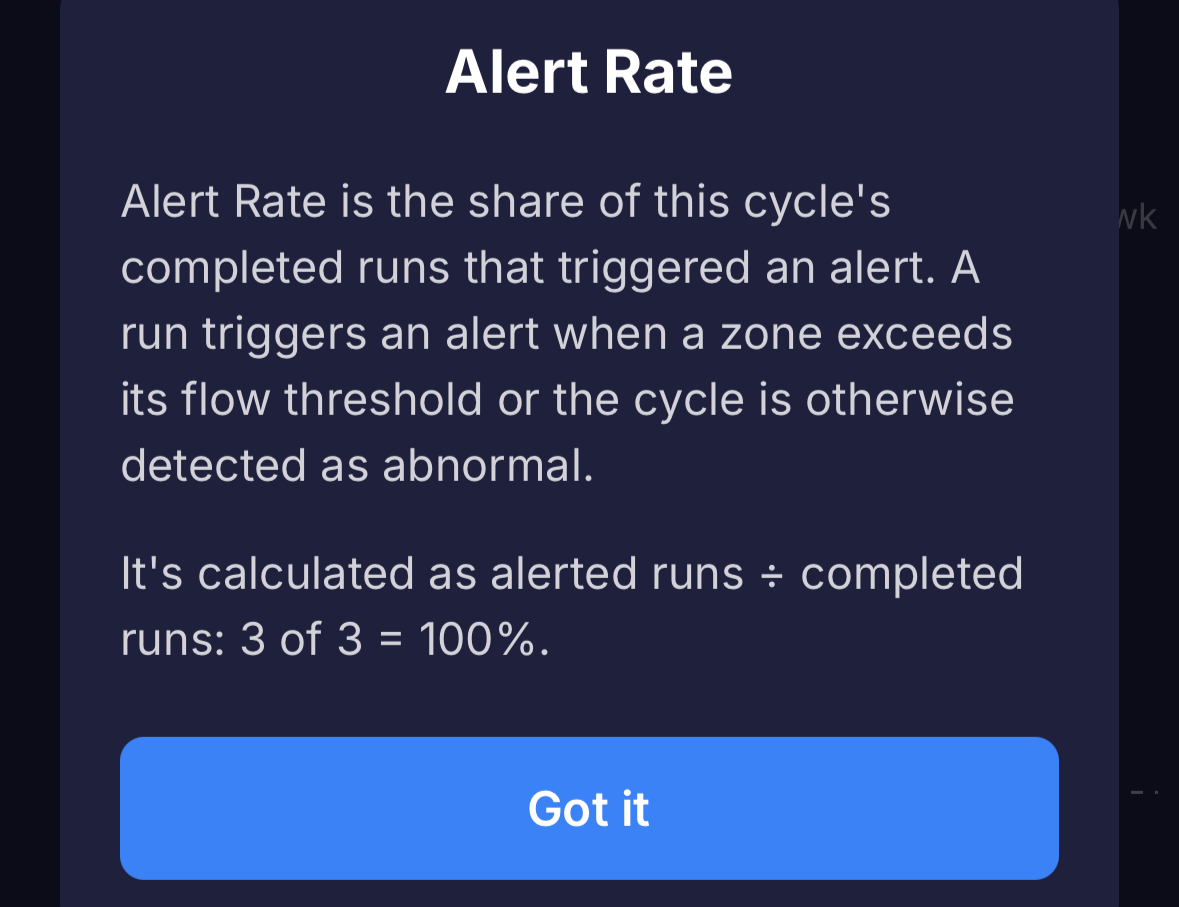 The Alert Rate stat and its info popup.
A note on detection
These summaries only change how recent history is presented, not when a Station breach is detected. A breach is still decided per Station, on Bluebot's servers, each time a Program runs. The more history Bluebot has, the more meaningful these trends are.
Troubleshooting
With Quick setup, Bluebot has a baseline for every station right after setup. Accuracy improves over the first couple of weeks as each program runs a few times.
That is usually normal flow variation, such as a change in city water pressure. Open Settings and widen that station's threshold. The default of plus or minus 20% is a good starting point for most drip systems.
Make sure water is actually flowing through the Bluebot meter while a station runs, and that you are running stations one at a time. If the run never appears, start setup over from the setup screen and try the "Test All Stations" mode on your controller again.
That is supported. After you confirm your first controller during setup, choose "Yes, set up another" and run all the stations on the next one.
Watering that did not match one of your recognized programs, such as a hose-end cycle or testing a station by hand. To be notified, turn on Manual Watering Started or Manual Watering Ended in Settings.
Yes, anytime. Open Settings and update the notify list.
Contact support
Smart Irrigation Monitor is in Beta. If something is not working or you have a question:
- Irrigation hotline: 1-888-BLU-4119, extension 8
- Support site: support.bluebot.com